Fig. 9.
Download original image
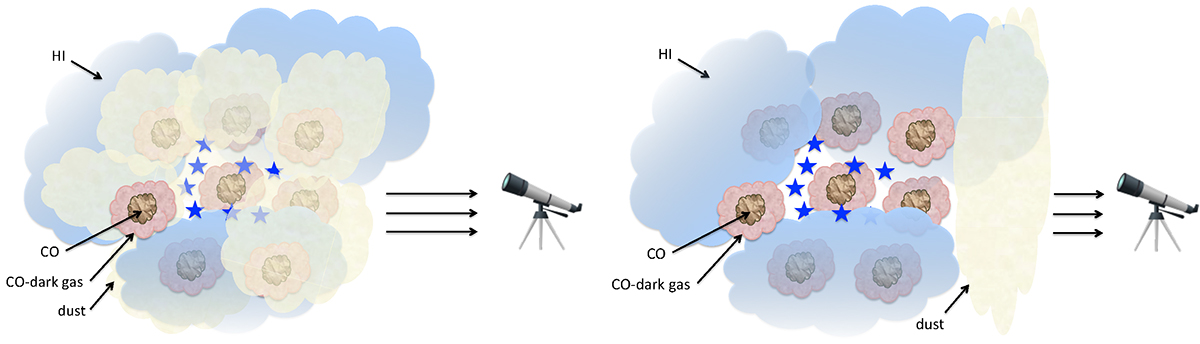
Left panel: Idealized cartoon illustrating the mixed configuration of dust, stars, and gas. Right panel: The same but with the foreground screen configuration. The amount of dust in the screen in the right panel is assumed to be roughly half of the total dust shown in the left panel. While the infrared τ160 penetrates the full dust column along the line of sight, the optical depth inferred from the Balmer decrement only captures the dust between the stars that ionize the gas and the observer.
Current usage metrics show cumulative count of Article Views (full-text article views including HTML views, PDF and ePub downloads, according to the available data) and Abstracts Views on Vision4Press platform.
Data correspond to usage on the plateform after 2015. The current usage metrics is available 48-96 hours after online publication and is updated daily on week days.
Initial download of the metrics may take a while.