Fig. A.1.
Download original image
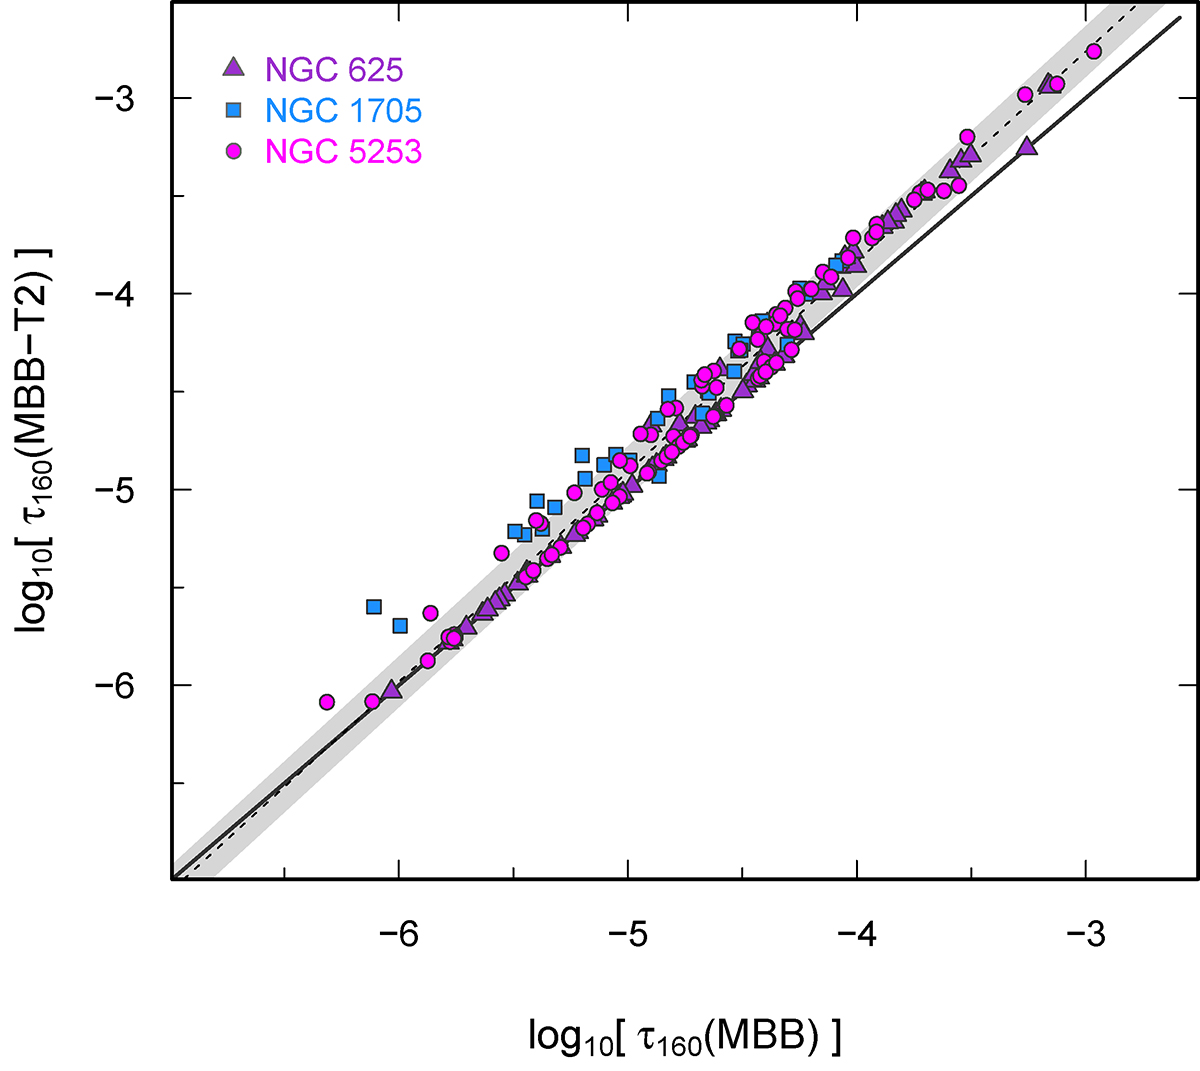
τ160 from MBB-T2 fits plotted against MBB τ160. log τ160(MBB − T2) = (1.073 ± 0.010) log τ160(MBB)+(0.46 ± 0.05) The scatter of the comparison is ∼0.13 dex; the shaded region denotes ± 1σ relative to the best fit. In general, τ160(MBB-T2) is larger than τ160(MBB), as shown by the nonunit power-law slope and positive intercept.
Current usage metrics show cumulative count of Article Views (full-text article views including HTML views, PDF and ePub downloads, according to the available data) and Abstracts Views on Vision4Press platform.
Data correspond to usage on the plateform after 2015. The current usage metrics is available 48-96 hours after online publication and is updated daily on week days.
Initial download of the metrics may take a while.