Fig. 12.
Download original image
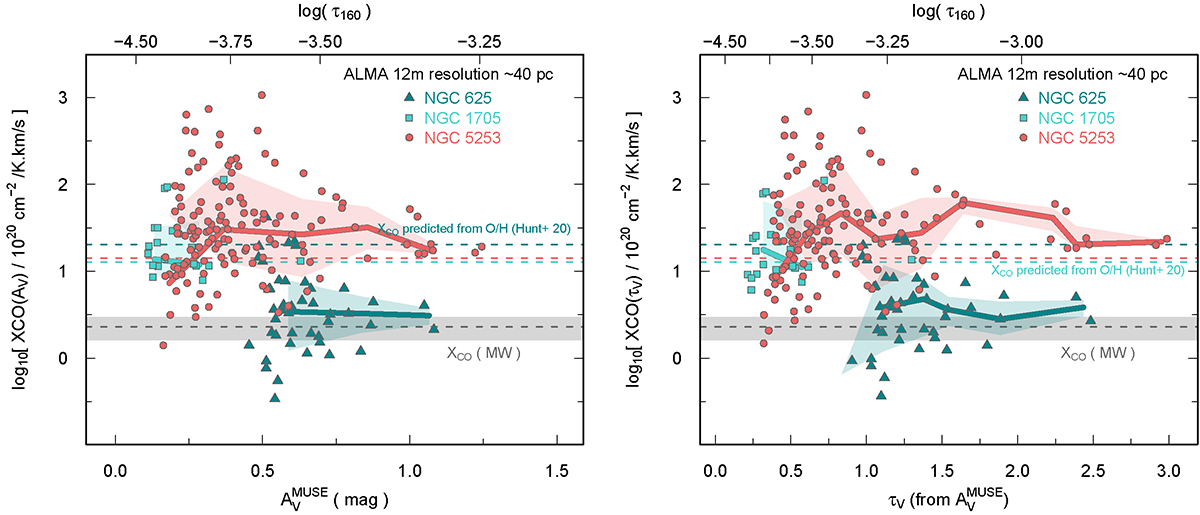
XCO estimated from Eq. (14) is plotted as a function of AV in the left panel, and of τV in the right. As in Fig. 8, we include as horizontal dashed lines, XCO that would be estimated from the metallicity dependence found by Hunt et al. (2020), as XCO ∝ Z−1.55. The MW XCO = 2.3 × 1020 cm−2/K km s−1 is also given together with the uncertainties. Heavy curves show the medians for each galaxy binned in ![]() (left) and τV (right) with shaded regions showing the 1σ standard deviations.
(left) and τV (right) with shaded regions showing the 1σ standard deviations.
Current usage metrics show cumulative count of Article Views (full-text article views including HTML views, PDF and ePub downloads, according to the available data) and Abstracts Views on Vision4Press platform.
Data correspond to usage on the plateform after 2015. The current usage metrics is available 48-96 hours after online publication and is updated daily on week days.
Initial download of the metrics may take a while.