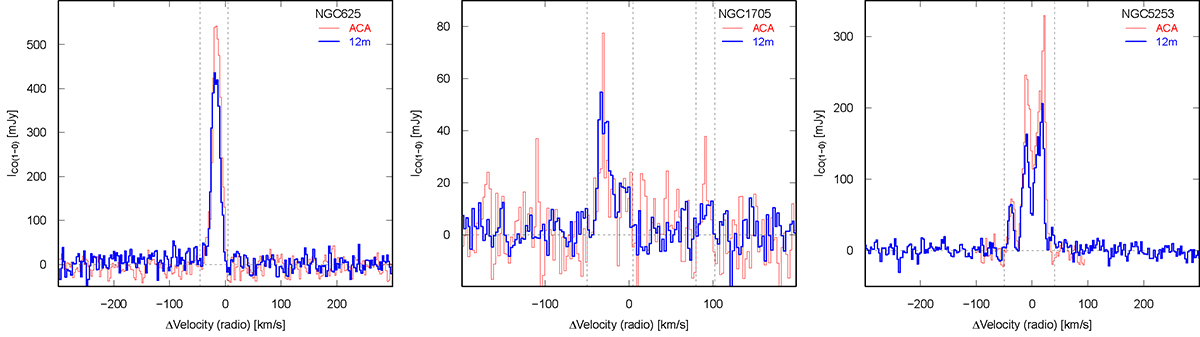
Fig. 1.
Download original image
CO spectra of the target galaxies within an aperture containing the totality of CO emission regions plotted against velocity, where Vsys is given in Table 2. The full-width at zero intensity (FWZI) corresponds to the vertical dotted lines (see Table 2, Col. (2)). The 12-m spectra are shown in blue, and the ACA in red. In NGC 5253, these are both continuum-subtracted spectra. More details are given in the text.
Current usage metrics show cumulative count of Article Views (full-text article views including HTML views, PDF and ePub downloads, according to the available data) and Abstracts Views on Vision4Press platform.
Data correspond to usage on the plateform after 2015. The current usage metrics is available 48-96 hours after online publication and is updated daily on week days.
Initial download of the metrics may take a while.