Fig. 4.
Download original image
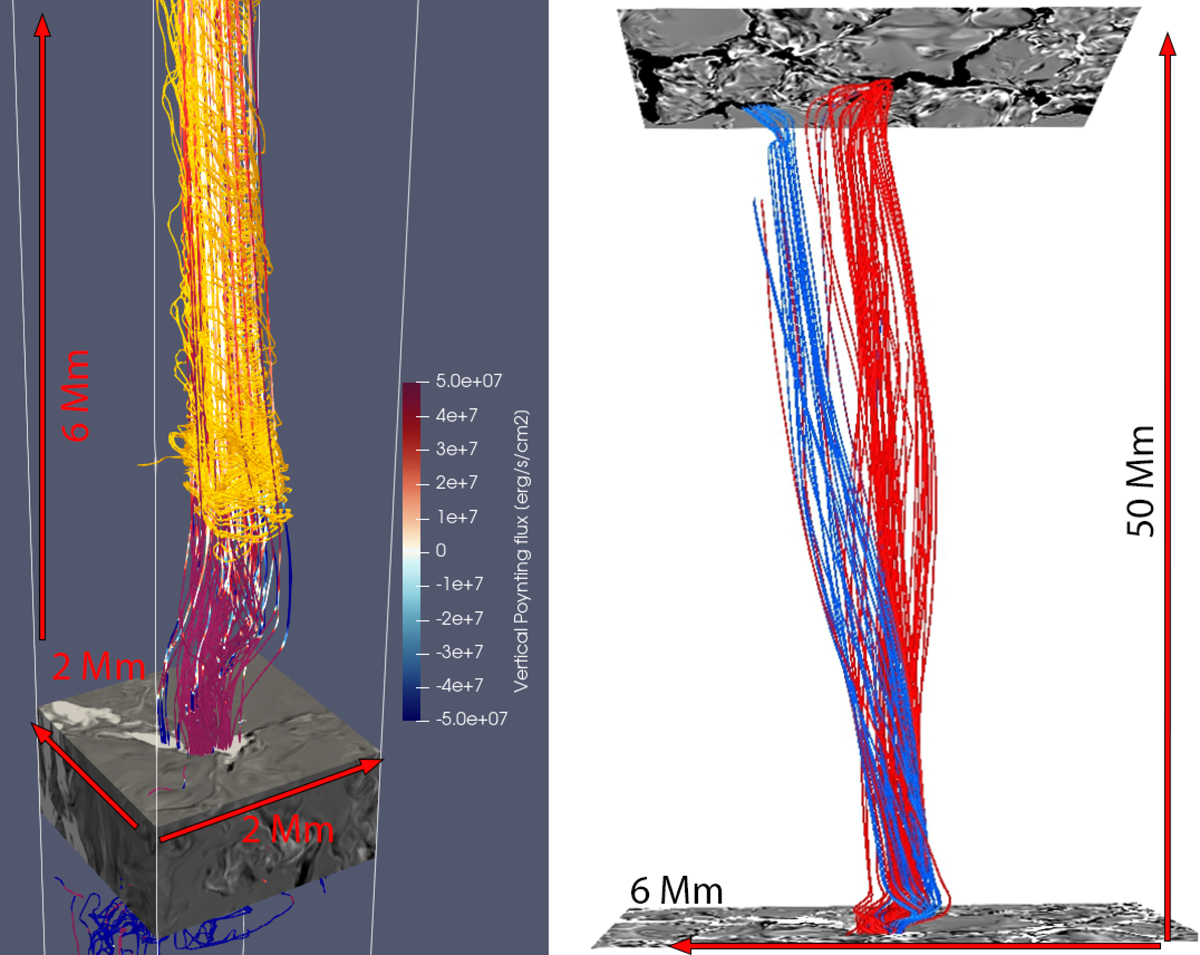
3D rendering of the magnetic field lines connected to the region with enhanced swirling strength shown in Fig. 2. Left panel: Closeup of the footpoint rooted in the swirl shown in Fig. 2. The field lines are color-coded with the axial component of the Poynting flux. Red corresponds to upward directed Poynting flux, while blue corresponds to downward directed Poynting flux. The range of the color scale is from −5 × 10⁷ to 5 × 10⁷ erg cm2s−1. The vertical magnetic field is plotted on a cut at the height of the ⟨τ⟩ = 1 surface. The range of the color scale of the magnetic field is from −1000 to 1000 G in the left panel and from −150 to 150 G in the right panel. The orange lines illustrate the streamlines of the velocity field traced from the swirl. Right panel: Magnetic topology of the structure rooted in the swirl. The field line bundles are colored red and blue, respectively, depending on which magnetic concentration they are rooted in at the footpoint plotted at the right. The probes show the vertical component of the magnetic field at the ⟨τ⟩ = 1 surface at each footpoint. In the right panel, the simulation box has been compressed by a factor of five in the axial direction for better visibility. See Sect. 3.1.
Current usage metrics show cumulative count of Article Views (full-text article views including HTML views, PDF and ePub downloads, according to the available data) and Abstracts Views on Vision4Press platform.
Data correspond to usage on the plateform after 2015. The current usage metrics is available 48-96 hours after online publication and is updated daily on week days.
Initial download of the metrics may take a while.