Fig. 2.
Download original image
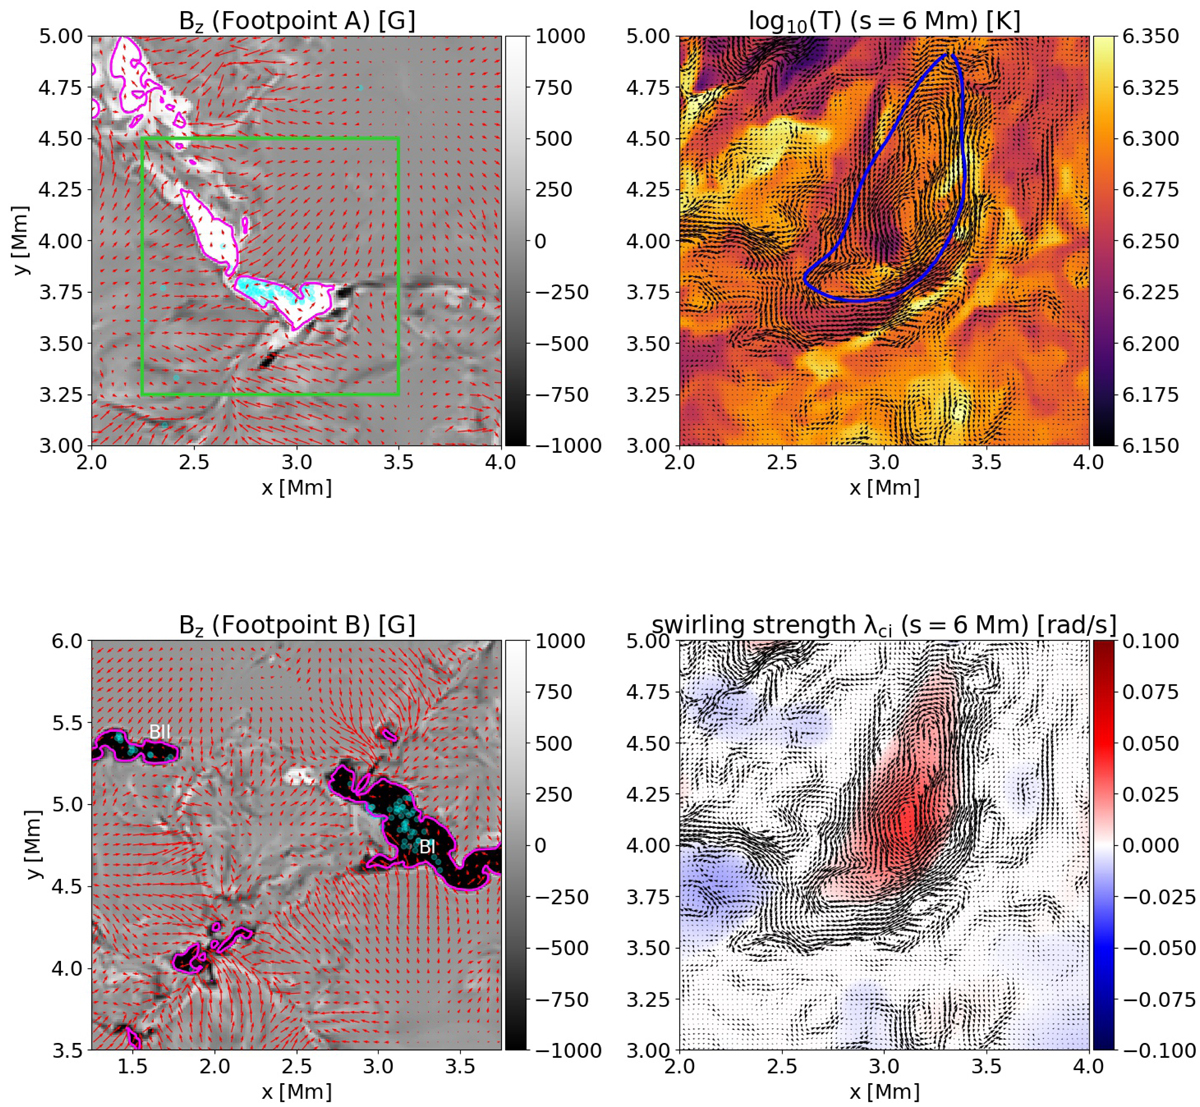
Swirling strength, temperature, and connection to the footpoints. Left column: Cuts at the photospheric level showing the vertical magnetic field component at both footpoints. The cut shown in the top left panel is located at a height of 0 Mm (footpoint A), the cut shown in the bottom left panel at an arclength of 50 Mm (footpoint B). The displayed cutouts correspond to the yellow and orange squares in Fig. 1. Upper-right panel: Temperature at s = 6 Mm. The blue contour is outlining a patch of enhanced swirling strength (|λci| = 0.002 rad s−1 for an effective resolution of 500 km after smoothing the velocity field to bring out the larger structures). The swirling strength calculated from the smoothed flow field is shown in the bottom right panel at an arclength of 6 Mm. The light blue circles in the left column show the intersection of the magnetic field lines traced from the region outlined in blue in the upper right panel with the photospheric layer. The magenta contours outline kilogauss magnetic field concentrations. The field of view of the closeup in Fig. 3 is indicated by the green square. The arrows show direction and magnitude of the velocity field perpendicular to the loop axis (see Sects. 3.1 and 4.3).
Current usage metrics show cumulative count of Article Views (full-text article views including HTML views, PDF and ePub downloads, according to the available data) and Abstracts Views on Vision4Press platform.
Data correspond to usage on the plateform after 2015. The current usage metrics is available 48-96 hours after online publication and is updated daily on week days.
Initial download of the metrics may take a while.