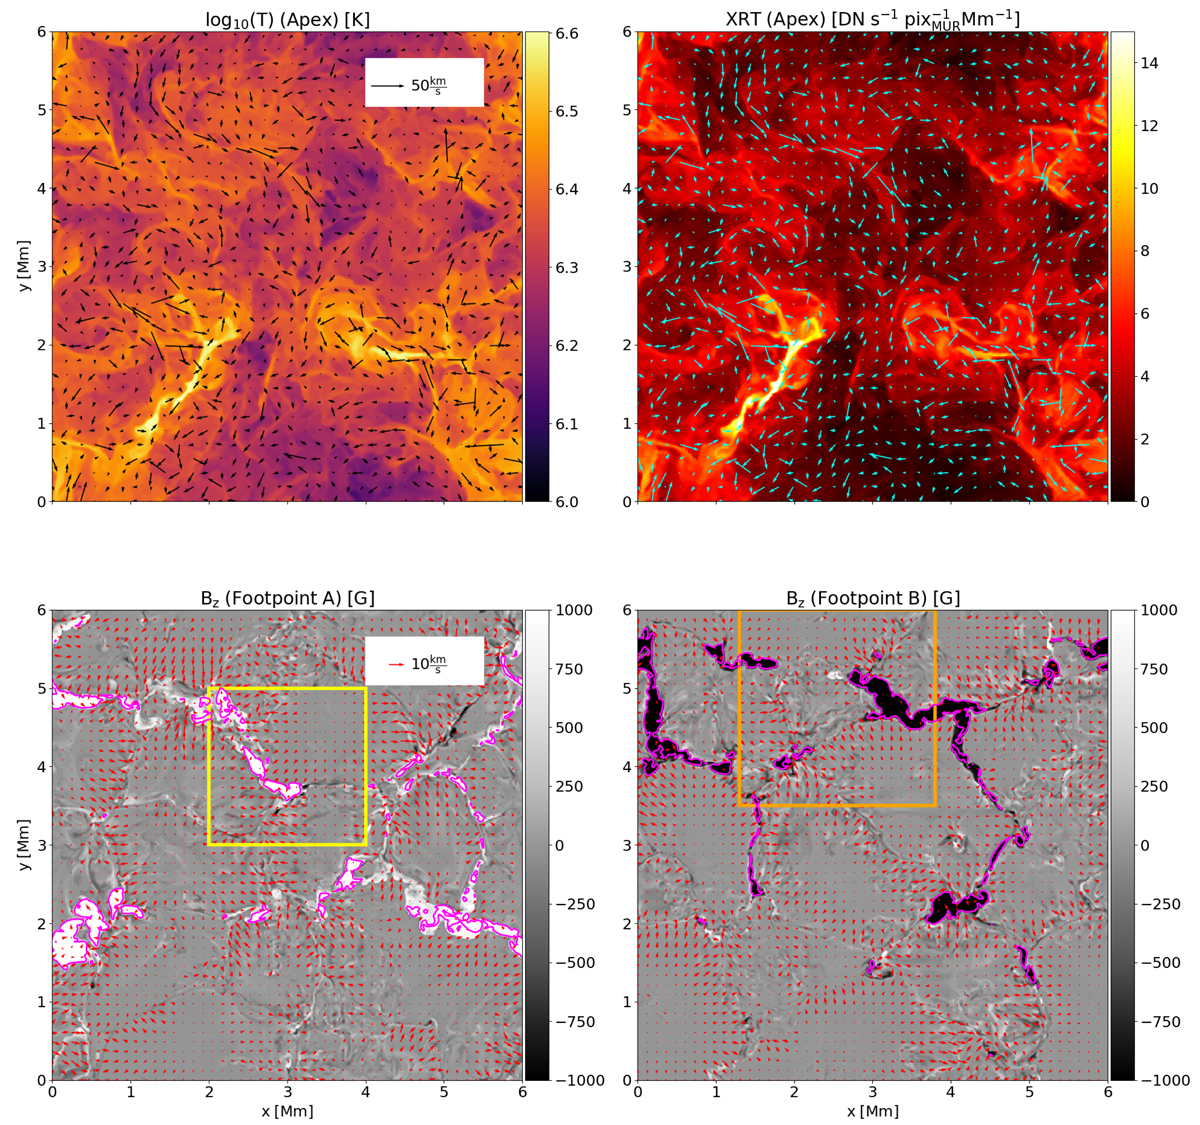
Fig. 1.
Download original image
Overview over the simulation box. Top row: Temperature distribution (left) and the emission as it would be seen with the Al-poly filter of the Hinode/XRT X-ray imager at the loop apex (right). Bottom row: Vertical magnetic field at the ⟨τ⟩ = 1 layer at both loop footpoints at s = 0 (left, footpoint A) and s = 50 (right, footpoint B). The arrows show magnitude and direction of the velocity field perpendicular to the loop axis. The yellow and orange rectangles mark the position of the closeups of the footpoints shown in Fig. 2. The magenta contours outline magnetic field concentrations with |Bz|≥1000 G. The snapshot was taken at T = 2.23 min. Data is taken after running the simulation at high resolution for 30 min. See Sect 2 for more details.
Current usage metrics show cumulative count of Article Views (full-text article views including HTML views, PDF and ePub downloads, according to the available data) and Abstracts Views on Vision4Press platform.
Data correspond to usage on the plateform after 2015. The current usage metrics is available 48-96 hours after online publication and is updated daily on week days.
Initial download of the metrics may take a while.