Fig. 8.
Download original image
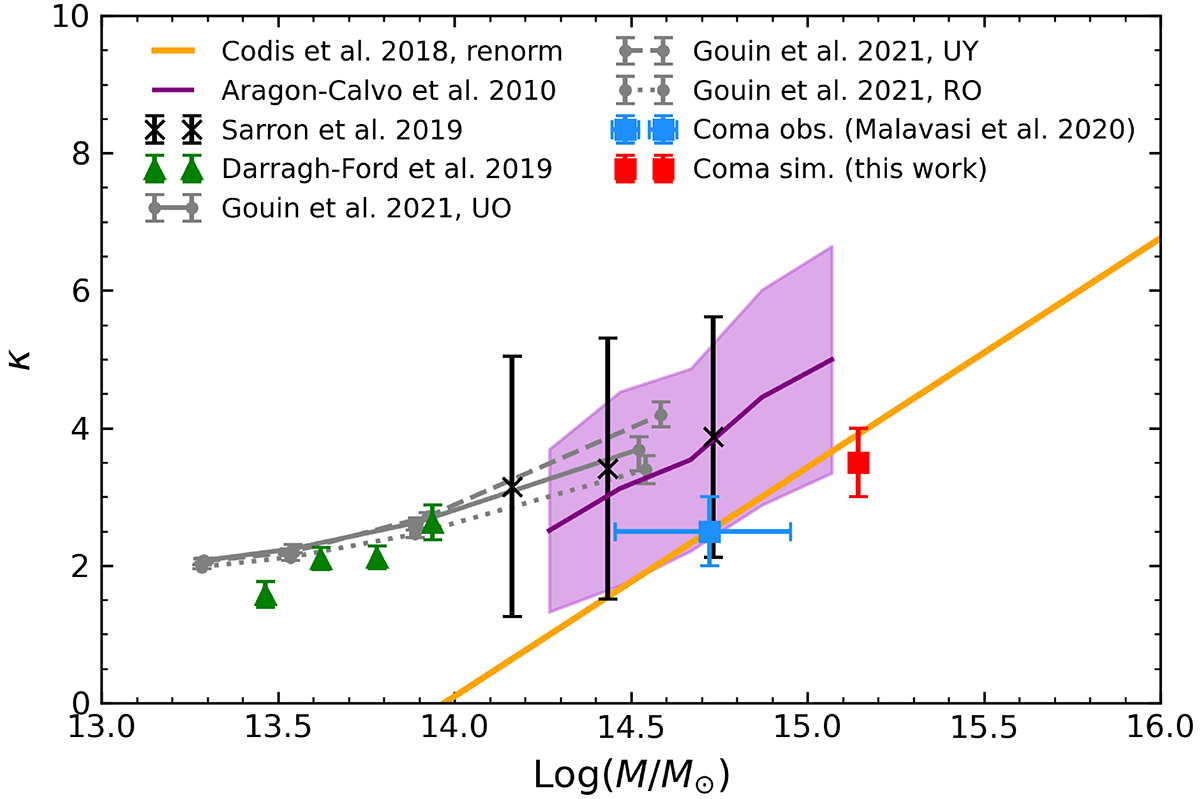
Connectivity of the real and simulated Coma clusters as a function of mass. The cyan square refers to the real Coma cluster as analyzed in Malavasi et al. (2020b), while the red square corresponds to the simulated Coma cluster as detected in this work. Black crosses are the observed connectivity values from the AMASCFI Clusters (Sarron et al. 2018, 2019), green triangles are the observed connectivity values for the groups in COSMOS (Darragh Ford et al. 2019). Gray lines and points are connectivity measurements derived in the IllustrisTNG simulation (Gouin et al. 2021) for clusters and groups which are unrelaxed and old (UO, solid line), relaxed and old (RO, dotted line), and unrelaxed and young (UY, dashed line). The purple line and shaded region are the relation from the numerical N-body simulations of Aragón-Calvo et al. (2010), and its corresponding 1σ uncertainty, while the solid orange line is the theoretical relation of Codis et al. (2018) renormalized to pass through our measurement for the real Coma cluster, so as to provide a better comparison of trends. We note that the mass on the x-axis of the plot is M200 for the real and simulated Coma, the measurements by Darragh Ford et al. (2019), and those of Sarron et al. (2019), while it is a value close to Mvir for the Aragón-Calvo et al. (2010) relation.
Current usage metrics show cumulative count of Article Views (full-text article views including HTML views, PDF and ePub downloads, according to the available data) and Abstracts Views on Vision4Press platform.
Data correspond to usage on the plateform after 2015. The current usage metrics is available 48-96 hours after online publication and is updated daily on week days.
Initial download of the metrics may take a while.