Fig. A.1.
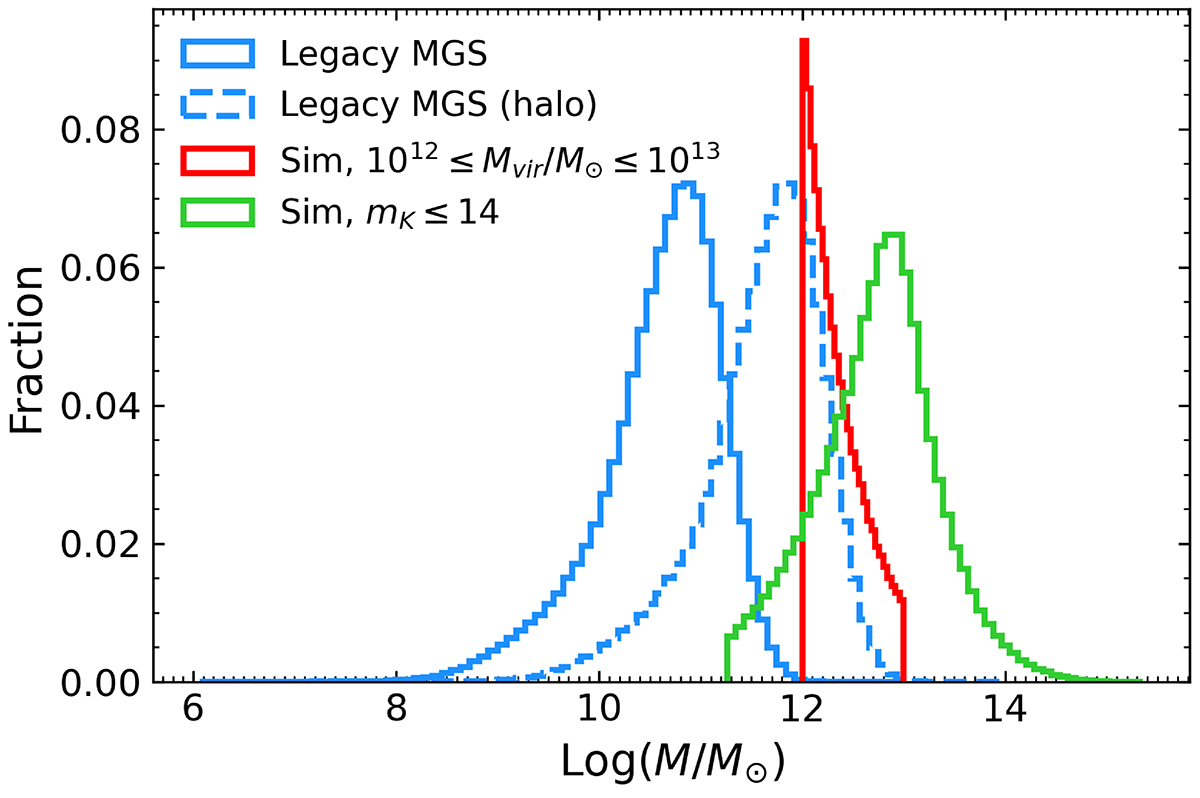
Download original image
Mass distributions for the halos in our simulation and for SDSS galaxies. The solid light blue line shows the mass distribution for Legacy MGS galaxies, while the dashed light blue line is the same distribution shifted by one order of magnitude to provide a reference for the expected position of the mass distribution of the halos hosting the Legacy MGS galaxies. The red line is the mass distribution for simulated galaxies selected through a cut in mass and the green line is the mass distribution of simulated galaxies selected through a cut in magnitude. We note that the mass reported on the x-axis is the stellar mass for SDSS galaxies and the virial mass for the halos and galaxies in our simulation.
Current usage metrics show cumulative count of Article Views (full-text article views including HTML views, PDF and ePub downloads, according to the available data) and Abstracts Views on Vision4Press platform.
Data correspond to usage on the plateform after 2015. The current usage metrics is available 48-96 hours after online publication and is updated daily on week days.
Initial download of the metrics may take a while.