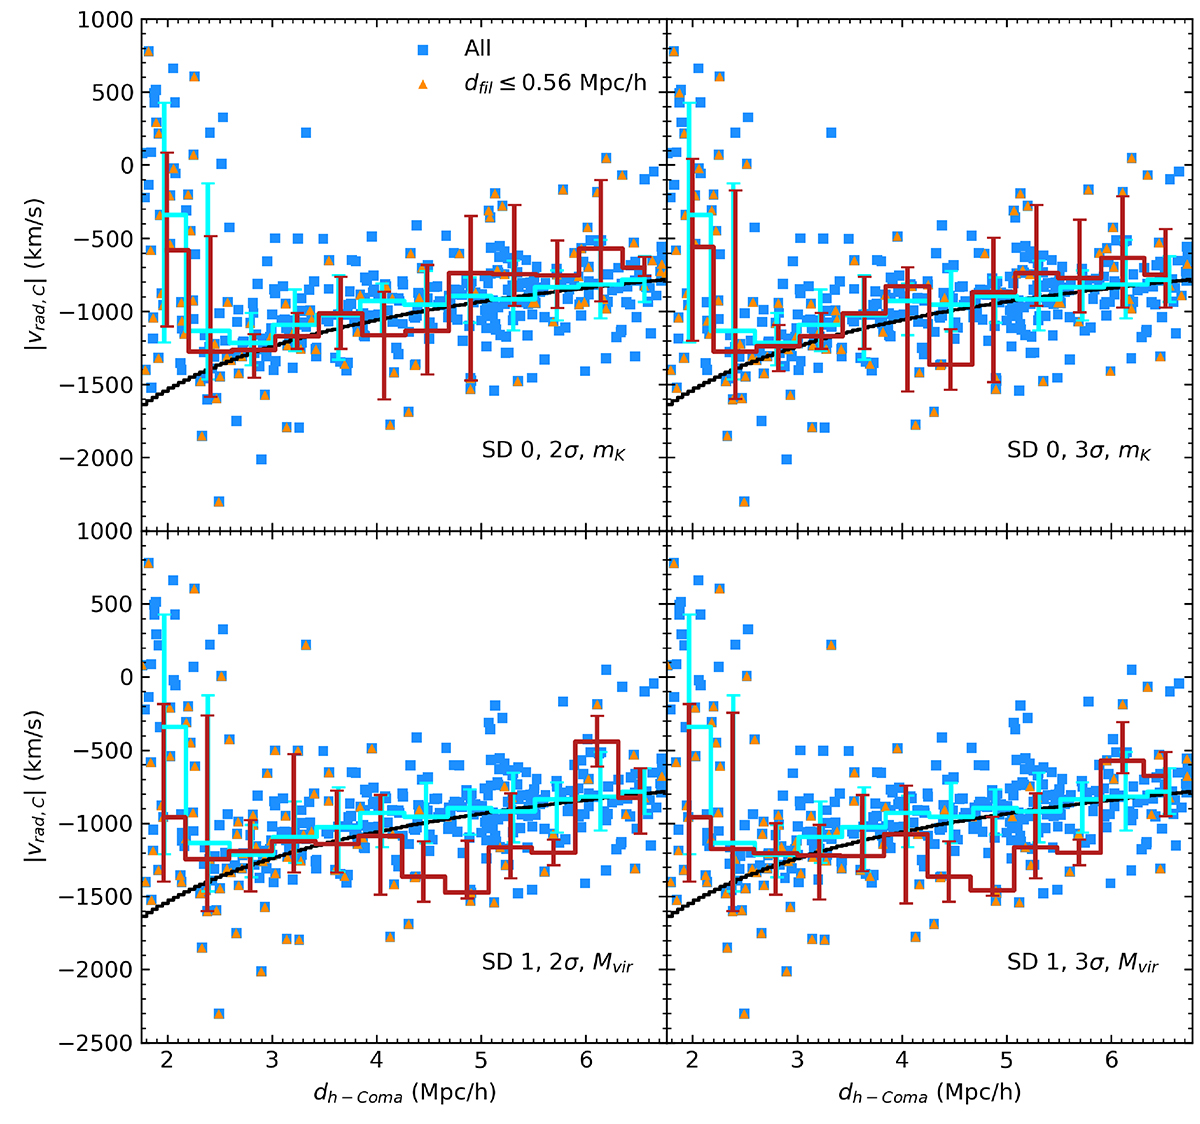
Fig. 10.
Download original image
Halo velocity as a function of distance from Coma. Each panel shows the halo velocity vrad, C as a function of the distance between each halo and the center of the simulated Coma cluster dh − Coma = |rh|. Only halos with rvir ≤ dh − Coma ≤ 10 Mpc (6.774 Mpc h−1) have been considered. Blue squares refer to all halos within this distance range, orange triangles are halos with dfil smaller than the 25th percentile of the dfil distribution. Solid lines refer to the running means of the distributions (cyan: all halos, red: halos close to filaments), error bars encompass the region between the 16th and the 84th percentile of the distributions. Different panels refer to different combinations of DisPerSE parameters and galaxy selections. In each panel, the black line shows the velocity that a body would reach as a function of distance from Coma by starting at 10 Mpc (6.774 Mpc h−1), with a velocity equal to the value of the last bin of the running mean as derived for the total halo population, and being subject only to the gravitational attraction of the Coma cluster.
Current usage metrics show cumulative count of Article Views (full-text article views including HTML views, PDF and ePub downloads, according to the available data) and Abstracts Views on Vision4Press platform.
Data correspond to usage on the plateform after 2015. The current usage metrics is available 48-96 hours after online publication and is updated daily on week days.
Initial download of the metrics may take a while.