Fig. 5.
Download original image
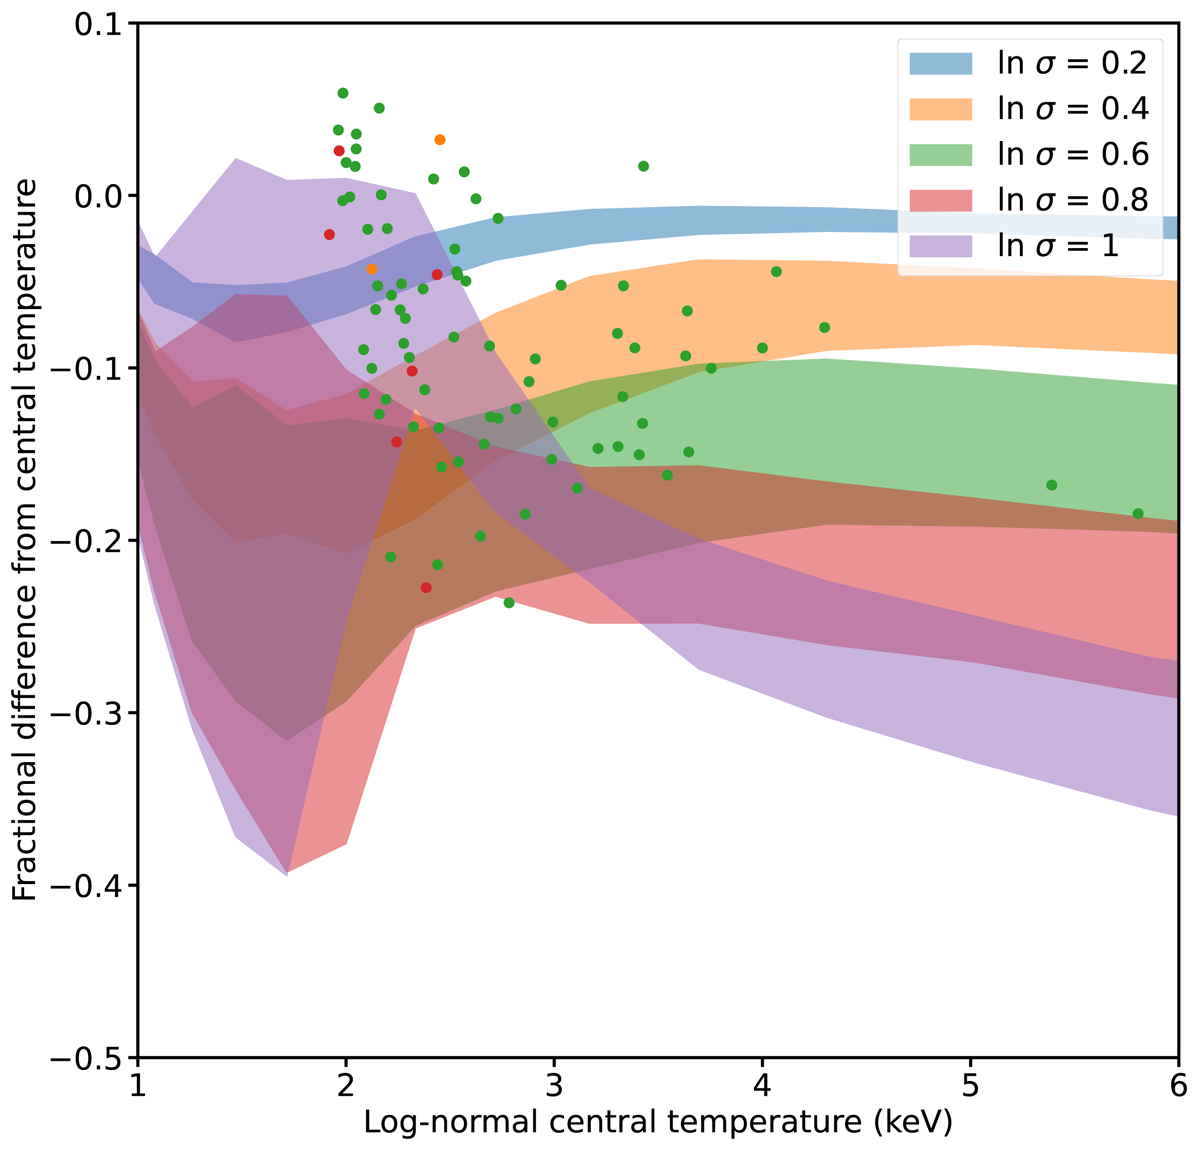
Fractional difference of the fitted temperature from the log-normal central temperature kT0 from the toy models and the 84 clusters from the simulation. The bands show the range of values for the four different combinations of redshift and abundance from the toy models described in Sect. 3.1. The points show the values computed from the clusters, where lnkT0 and lnσ were computed using sample means and variances weighted by the emission measure of the SPH particles. The points are color-coded according to the value of lnσ they are closest to (within Δlnσ = 0.1).
Current usage metrics show cumulative count of Article Views (full-text article views including HTML views, PDF and ePub downloads, according to the available data) and Abstracts Views on Vision4Press platform.
Data correspond to usage on the plateform after 2015. The current usage metrics is available 48-96 hours after online publication and is updated daily on week days.
Initial download of the metrics may take a while.