Fig. 15.
Download original image
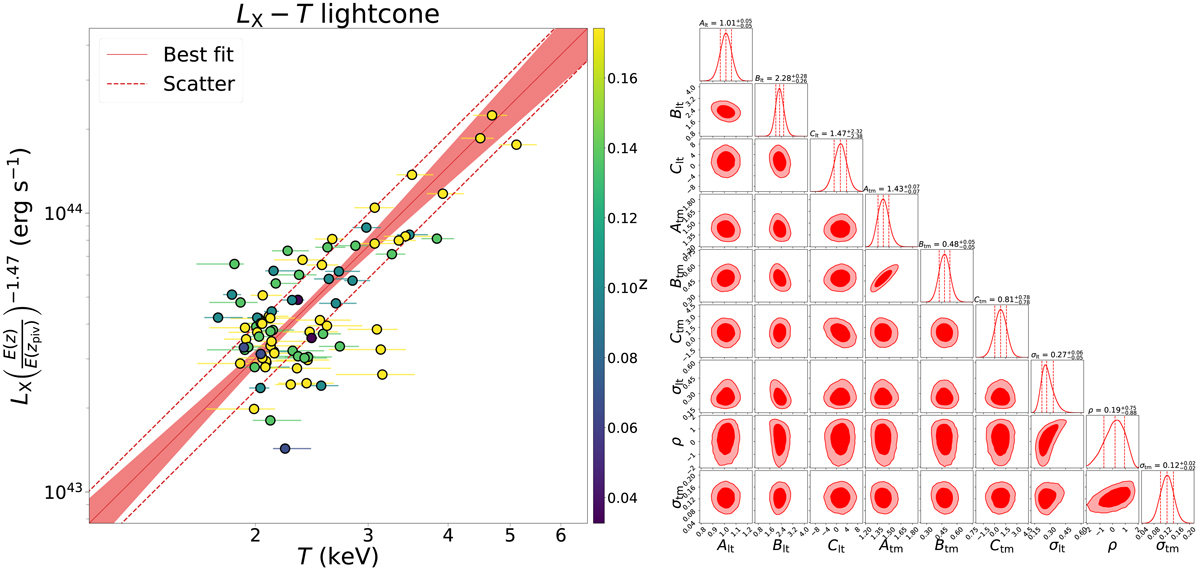
Results of the LX − T scaling relation analysis. Left: best-fitting scaling relation model to the soft band (0.5 − 2.0 keV) X-ray luminosity (LX), temperature (T), and redshift (z) measurements of the lightcone sample. The solid red line represents the best-fit line, the red shaded area represents ±1σ uncertainty of the mean of the relation (see first row of μ in Eq. (6)), and the dashed red line represents the intrinsic scatter of the relation (σL|T) around the mean. Right: marginal and joint posterior distributions of the jointly modeled LX − T and T − M500c relations obtained from the second half of the MCMC chains. The red dashed vertical lines indicate the 32nd, 50th, and 68th percentiles, and the contours indicate the 68% and 95% credibility regions.
Current usage metrics show cumulative count of Article Views (full-text article views including HTML views, PDF and ePub downloads, according to the available data) and Abstracts Views on Vision4Press platform.
Data correspond to usage on the plateform after 2015. The current usage metrics is available 48-96 hours after online publication and is updated daily on week days.
Initial download of the metrics may take a while.