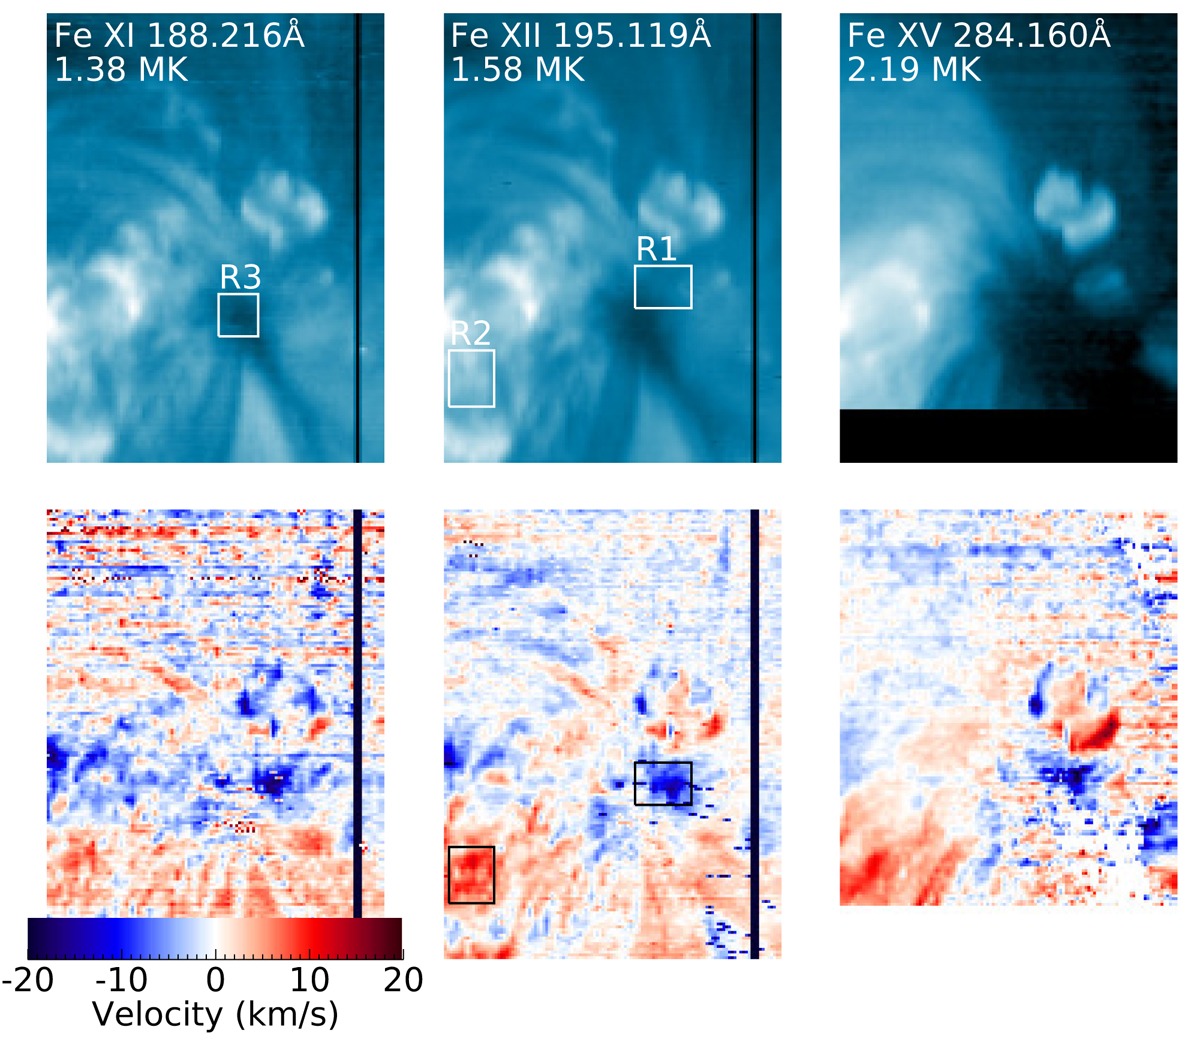
Fig. 6.
Download original image
EIS intensity (top) and Doppler velocity (bottom) maps as a function of increasing temperature (from left to right) for the raster used to measure the composition on 6 March 2022 23:26. The Fe XII 195.119 Å line here is deblended from the density sensitive 195.18 Å line. The data are resampled to an arcsec scale. The box (R3) on the Fe XI 188.216 Å intensity map shows where the composition measurement was made in the sunspot umbra. The boxes on the Fe XII 195.119 Å maps show the locations where the plasma composition measurements were made in the unusual blue-shifted upflow on the sunspot umbra (R1) and the red-shifted active region loops (R2). The Fe XV 284.160 Å image has been shifted upwards to account for the offset between the short- and long-wavelength detectors.
Current usage metrics show cumulative count of Article Views (full-text article views including HTML views, PDF and ePub downloads, according to the available data) and Abstracts Views on Vision4Press platform.
Data correspond to usage on the plateform after 2015. The current usage metrics is available 48-96 hours after online publication and is updated daily on week days.
Initial download of the metrics may take a while.