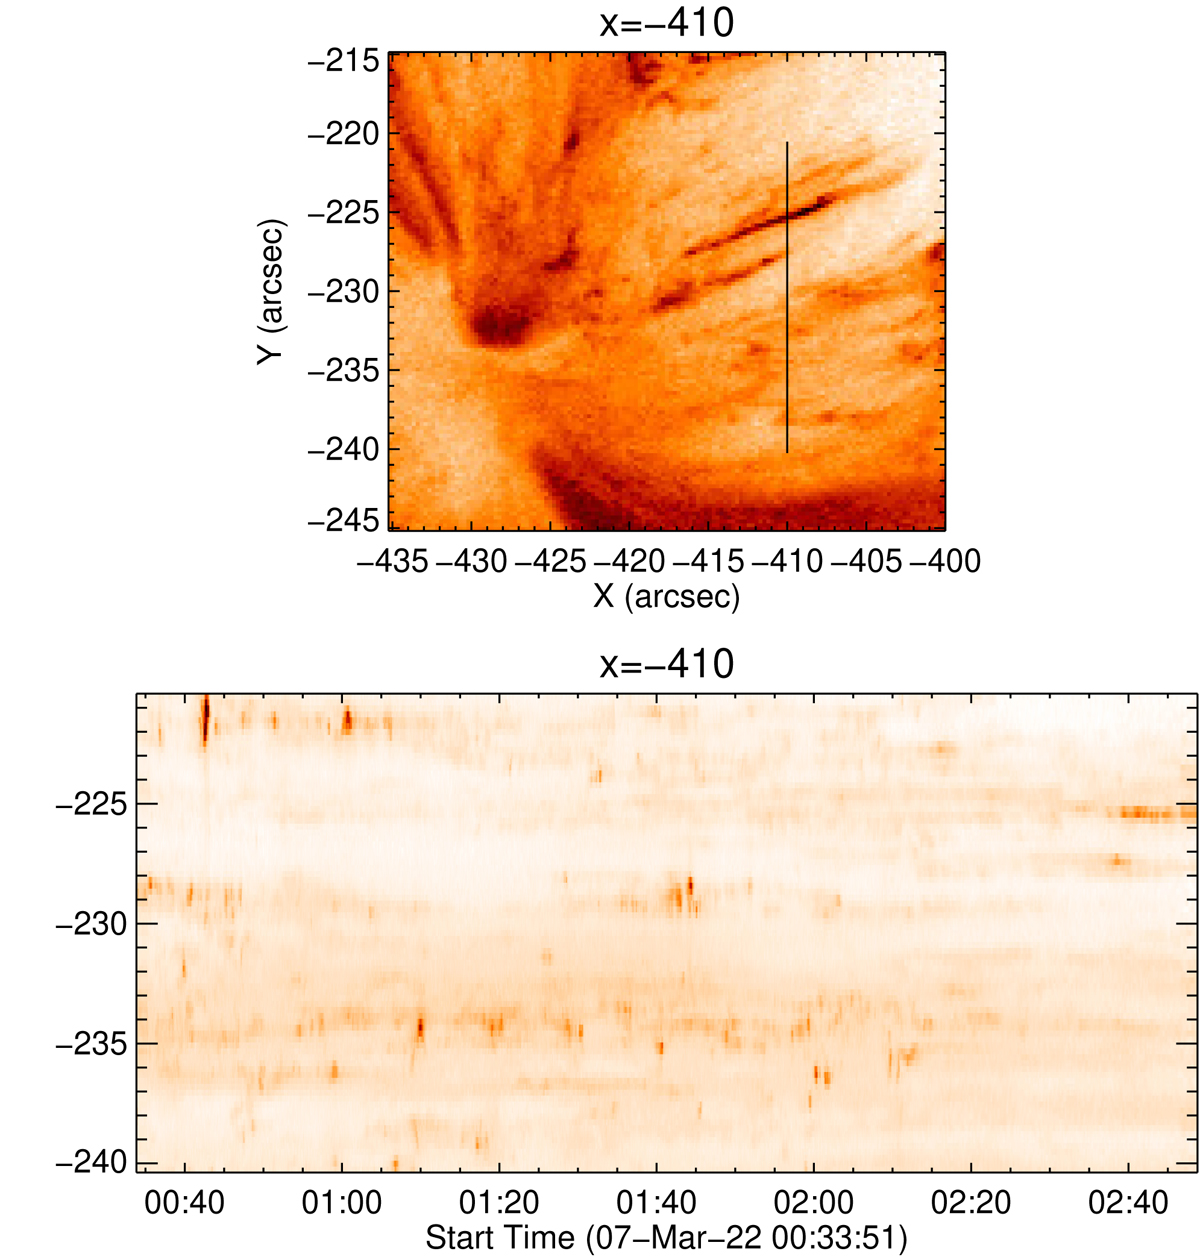
Fig. 5.
Download original image
Stack plot of the HRIEUV data across the small dynamic loops. Top panel: zoom in of the HRIEUV image focusing on the small-scale loops related to the upflows. A reverse colour table is used. Lower panel: stack plot with the y-axis at the position along the slit in arcsec across the loops to illustrate the dynamics. The x-axis shows time. The loops brighten and fade within only minutes.
Current usage metrics show cumulative count of Article Views (full-text article views including HTML views, PDF and ePub downloads, according to the available data) and Abstracts Views on Vision4Press platform.
Data correspond to usage on the plateform after 2015. The current usage metrics is available 48-96 hours after online publication and is updated daily on week days.
Initial download of the metrics may take a while.