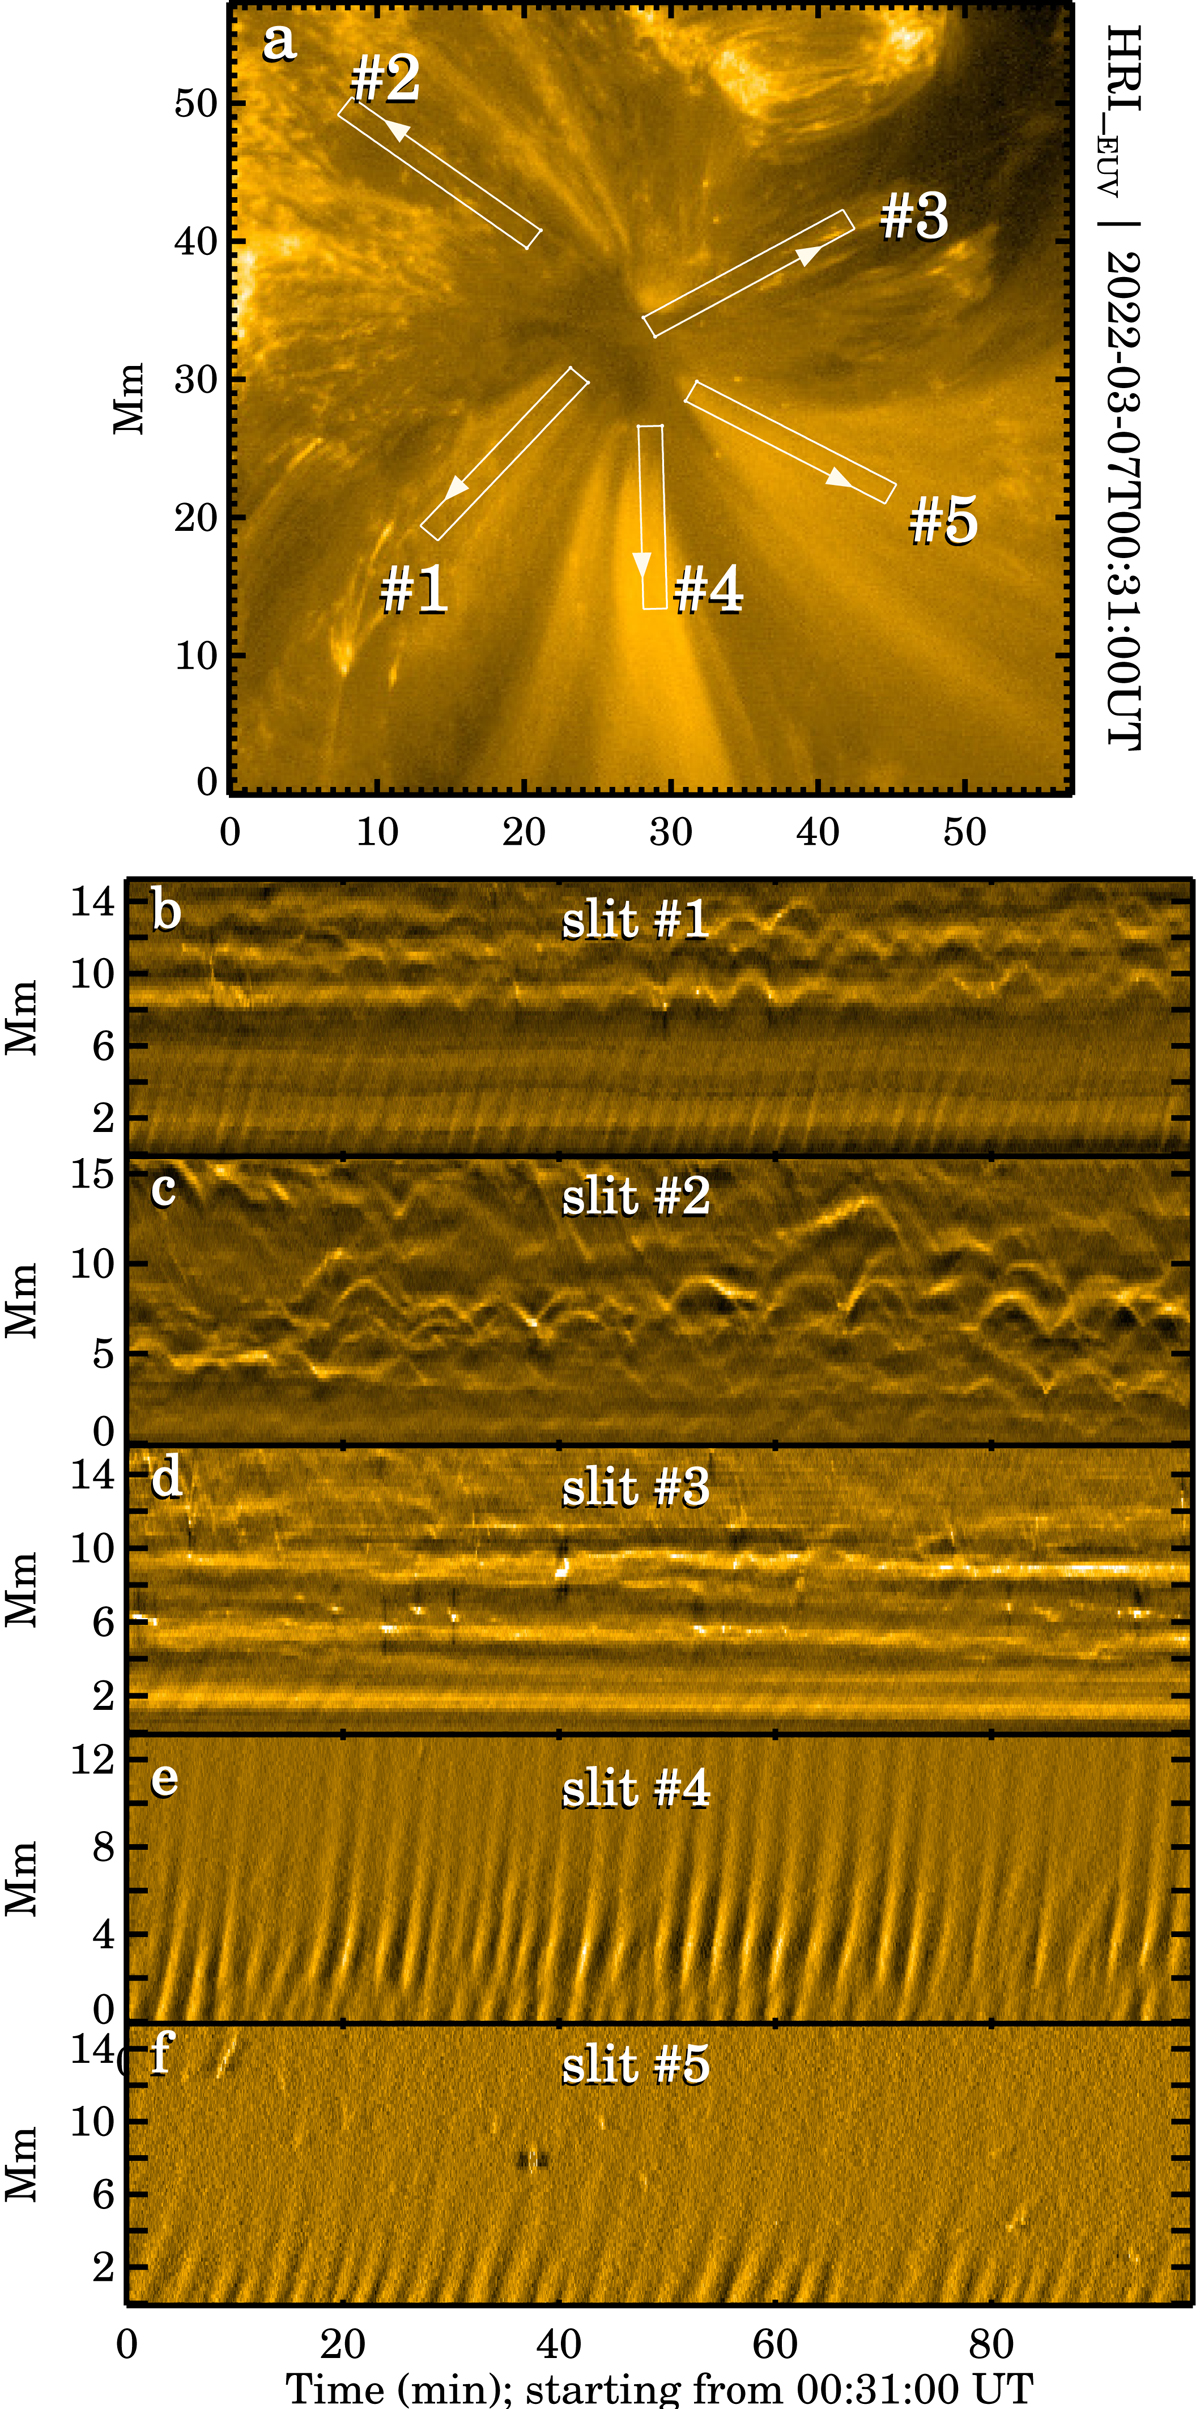
Fig. 4.
Download original image
Stack plots in different locations around the active region. Top panel a: HRIEUV image with artificial slits (white boxes) overlaid on it. Bottom panels b–f: Space-time plots derived using the artificial slits in panel a. The regions with Slits 1 and 2 behave like dynamic fibrils, while Slits 5 and 4 have propagating disturbances. Slit 3, which resides within the blue-shifted feature we noted earlier, shows multiple small bright features that change with time. An animated version of this figure is available online.
Current usage metrics show cumulative count of Article Views (full-text article views including HTML views, PDF and ePub downloads, according to the available data) and Abstracts Views on Vision4Press platform.
Data correspond to usage on the plateform after 2015. The current usage metrics is available 48-96 hours after online publication and is updated daily on week days.
Initial download of the metrics may take a while.