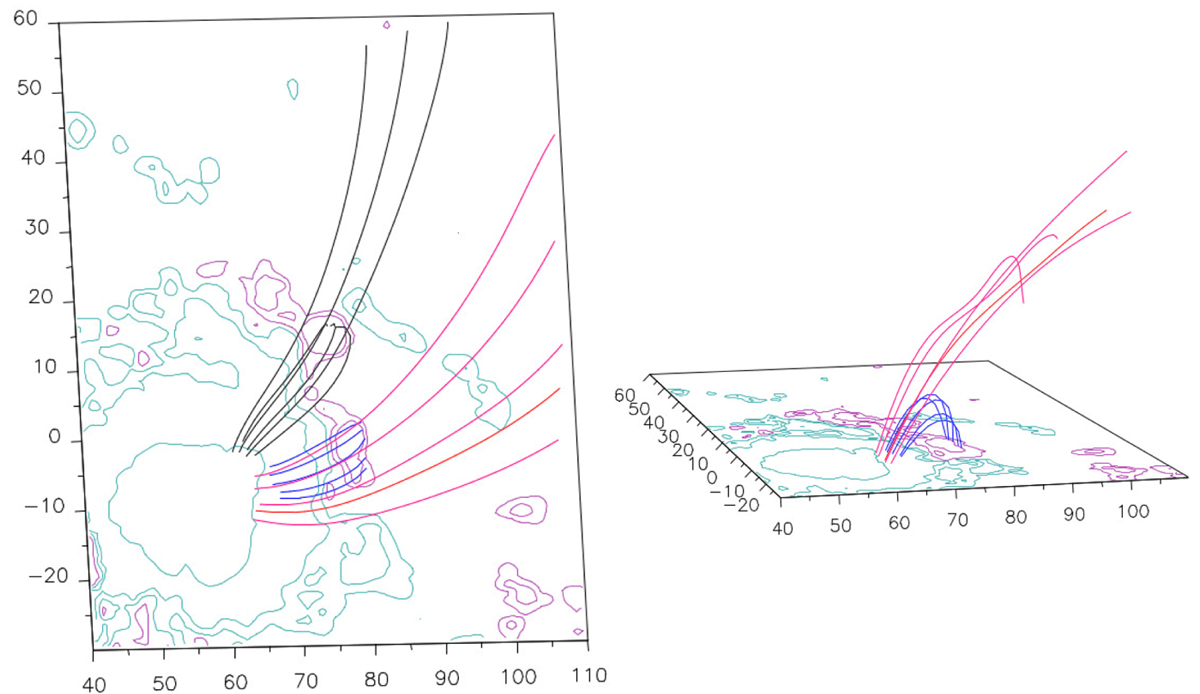
Fig. 10.
Download original image
Magnetic field models for the active region. Left panel: zoom of the magnetic field model of AR 12960 with sets of computed lines starting at integration in the umbral and penumbral region to the west of the preceding sunspot. The blue lines correspond to the short dynamic loops observed with HRIEUV. The red lines anchored in the umbra correspond to large-scale loops; these lines reach the border of the integration box. The set of black lines were added to show the change in connectivity. Right panel: same set of field lines shown in the left panel (except the black set) but from a different perspective. This image illustrates the relation between short- and large-scale structures. The height of the field lines has been arbitrarily multiplied by a factor of three for better visibility. The convention for isocontours and axes labels is the same as for Fig. 9.
Current usage metrics show cumulative count of Article Views (full-text article views including HTML views, PDF and ePub downloads, according to the available data) and Abstracts Views on Vision4Press platform.
Data correspond to usage on the plateform after 2015. The current usage metrics is available 48-96 hours after online publication and is updated daily on week days.
Initial download of the metrics may take a while.