Fig. 2
Download original image
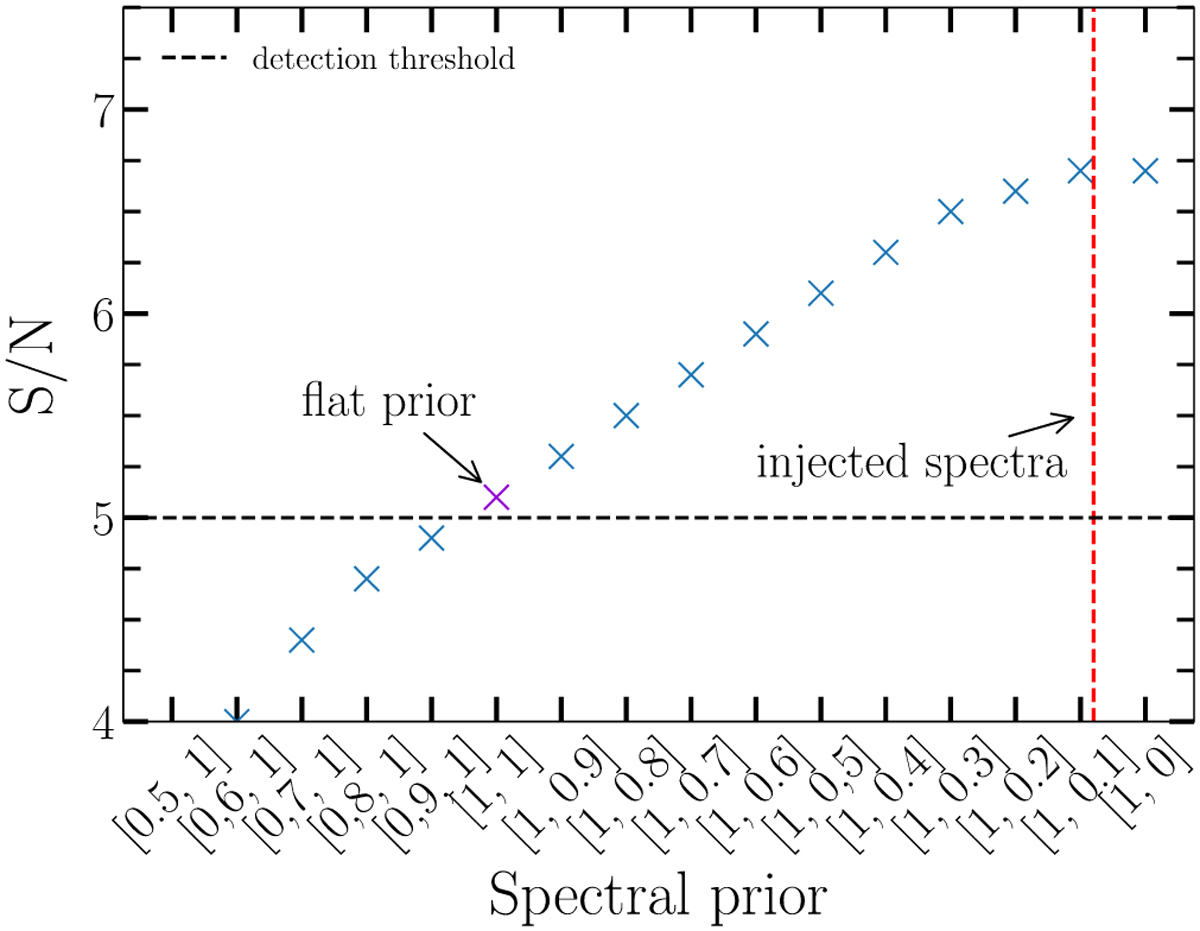
Evolution of the S/N (blue) for various priors for a point source observed with IRDIS, and whose spectrum corresponds to the red mark. The x-axis gives various values of the priors. The S/N corresponding to the [0.5, 1] prior (significantly different from the normalized contrast of the injected source) is below the 4σ threshold used for this analysis, while the S/N reached for spectral prior [1, 0.1] (similar to the normalized contrast of the injected source) leads to a clear detection with a significance above the 5σ detection threshold (dashed black line).
Current usage metrics show cumulative count of Article Views (full-text article views including HTML views, PDF and ePub downloads, according to the available data) and Abstracts Views on Vision4Press platform.
Data correspond to usage on the plateform after 2015. The current usage metrics is available 48-96 hours after online publication and is updated daily on week days.
Initial download of the metrics may take a while.