Fig. 17
Download original image
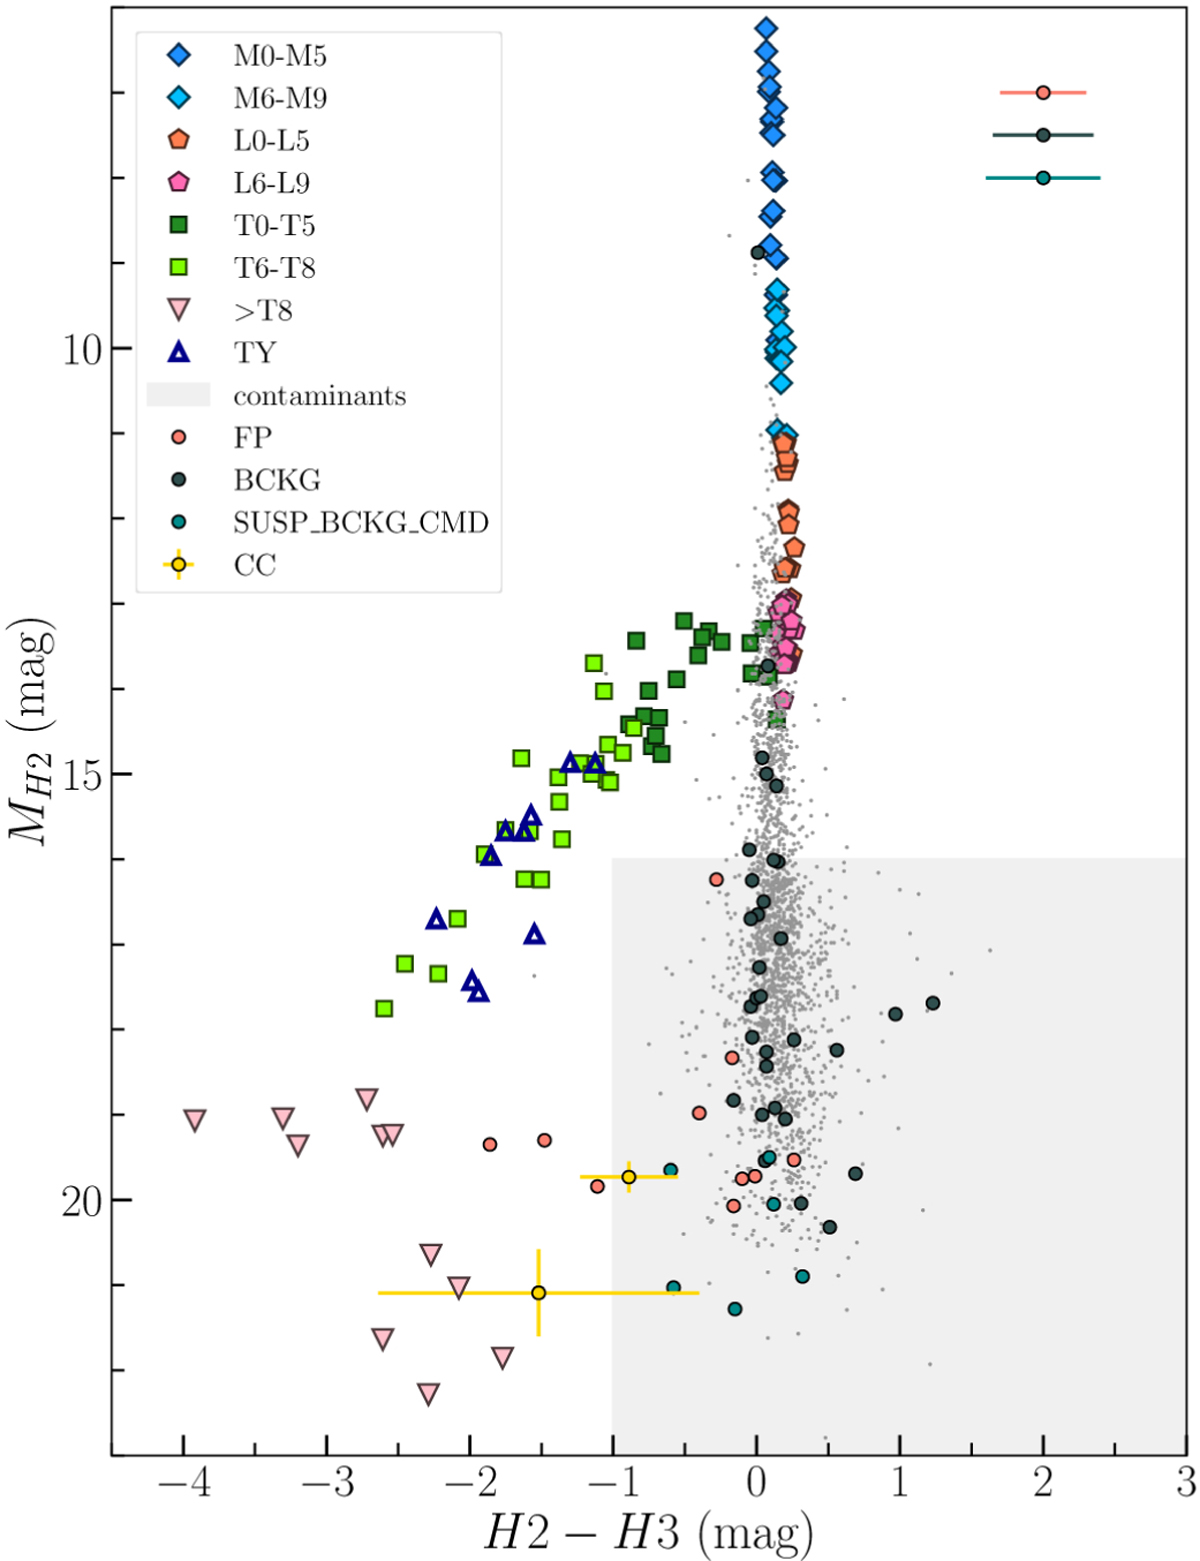
CMD plot with the classification of the 60 sources detected during the survey. Note: individual error bars are not shown for clarity purposes except for the two most interesting candidates (yellow circles). Typical error bars are indicated in the top right. The grey dots represent the background sources identified during the SHINE F150 survey.
Current usage metrics show cumulative count of Article Views (full-text article views including HTML views, PDF and ePub downloads, according to the available data) and Abstracts Views on Vision4Press platform.
Data correspond to usage on the plateform after 2015. The current usage metrics is available 48-96 hours after online publication and is updated daily on week days.
Initial download of the metrics may take a while.