Open Access
Fig. 14
Download original image
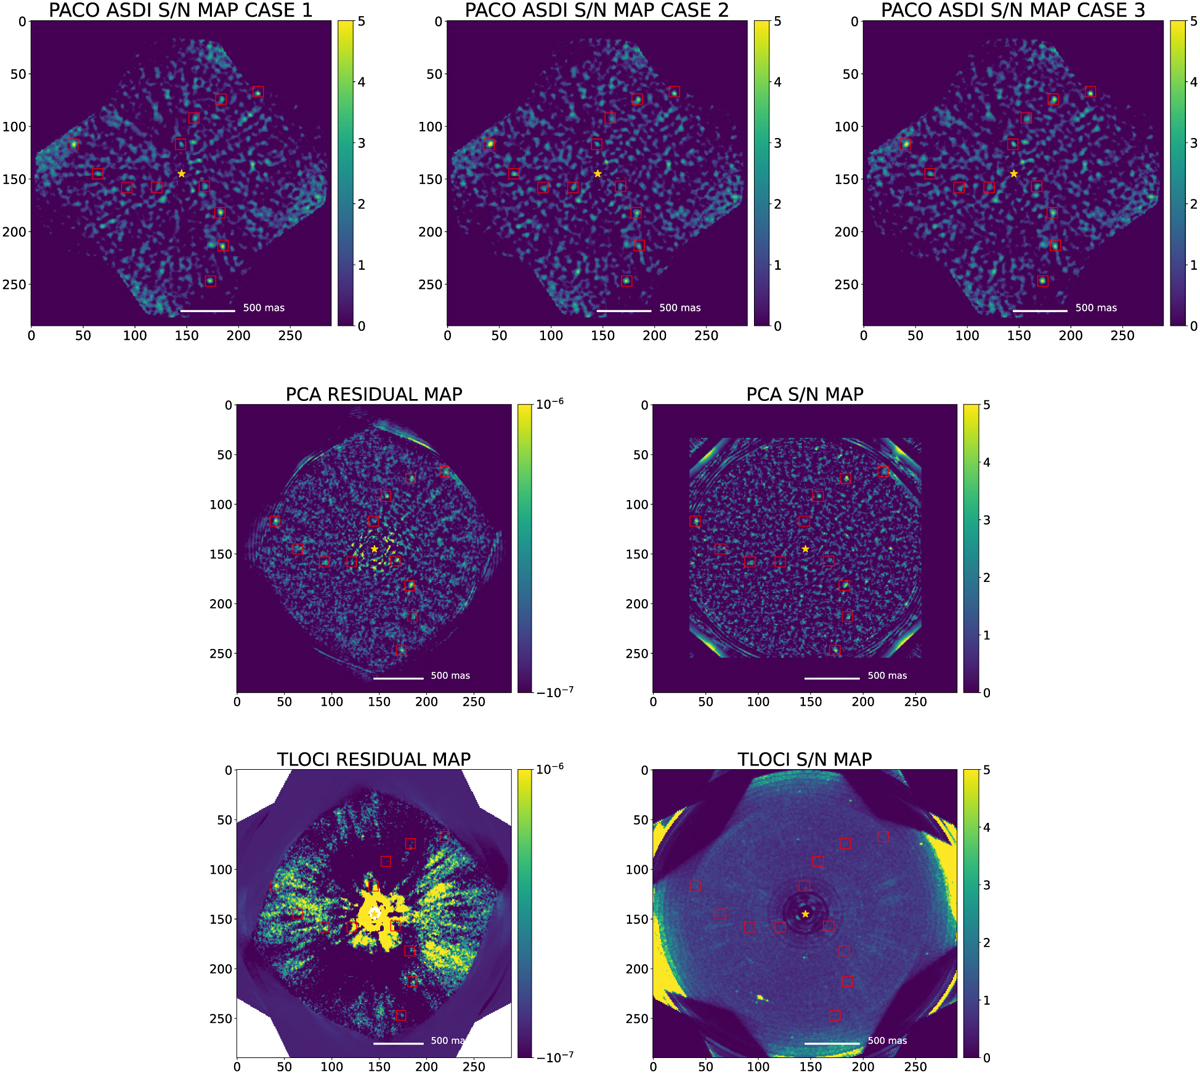
S/N and residual maps for the injected fake sources on IFS. Top row: PACO ASDI S/N maps corresponding to the various injected spectra (see Fig. B.7). Middle row: Residual and S/N maps using PCA. Bottom row: Residual and S/N maps using TLOCI. The locations of injected sources are highlighted by red boxes.
Current usage metrics show cumulative count of Article Views (full-text article views including HTML views, PDF and ePub downloads, according to the available data) and Abstracts Views on Vision4Press platform.
Data correspond to usage on the plateform after 2015. The current usage metrics is available 48-96 hours after online publication and is updated daily on week days.
Initial download of the metrics may take a while.