Open Access
Fig. 13
Download original image
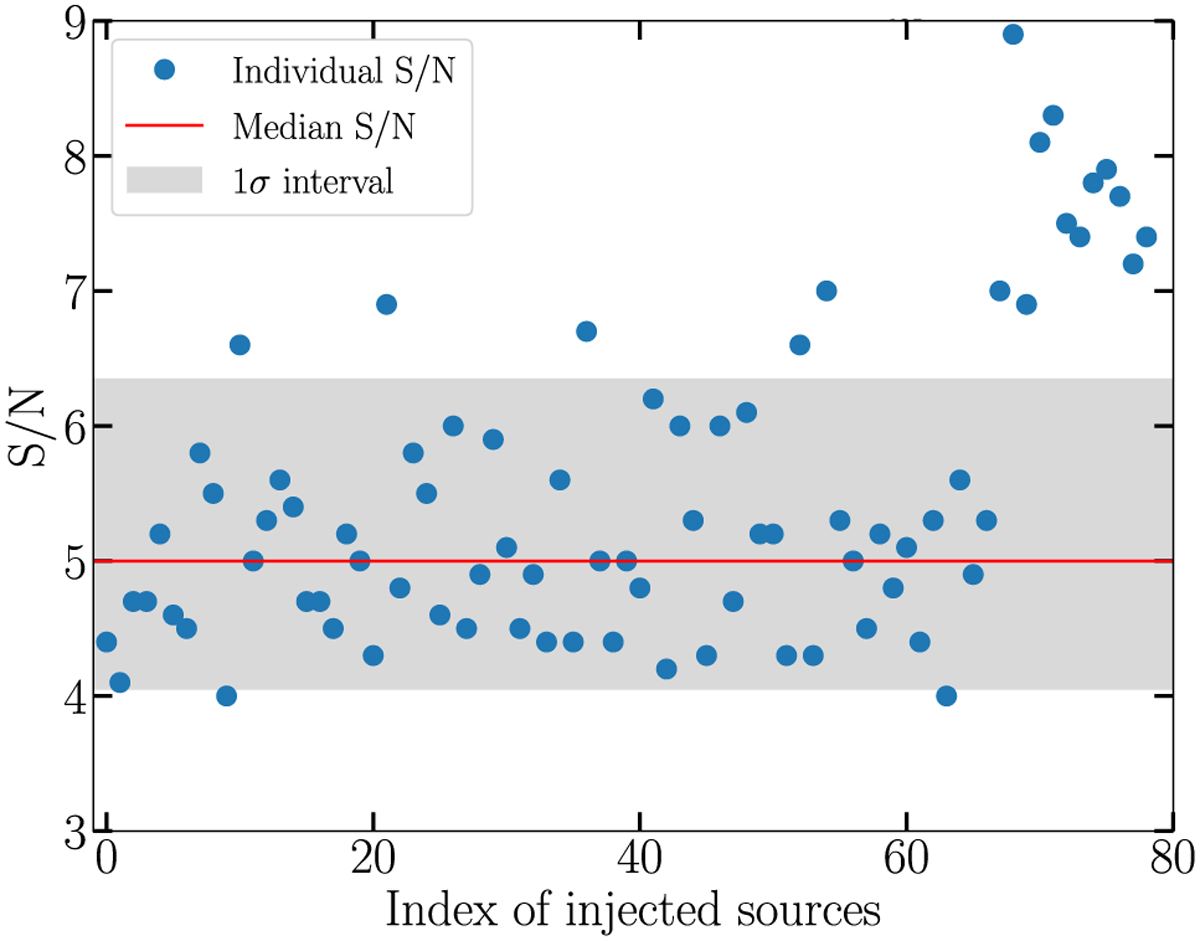
Retrieved S/N for the injected sources for IRDIS. The detection threshold τ was set to 4. The red line shows the median S/N of the injected sources and the grey area the 1σ interval containing 68% of the detected injected sources.
Current usage metrics show cumulative count of Article Views (full-text article views including HTML views, PDF and ePub downloads, according to the available data) and Abstracts Views on Vision4Press platform.
Data correspond to usage on the plateform after 2015. The current usage metrics is available 48-96 hours after online publication and is updated daily on week days.
Initial download of the metrics may take a while.