Open Access
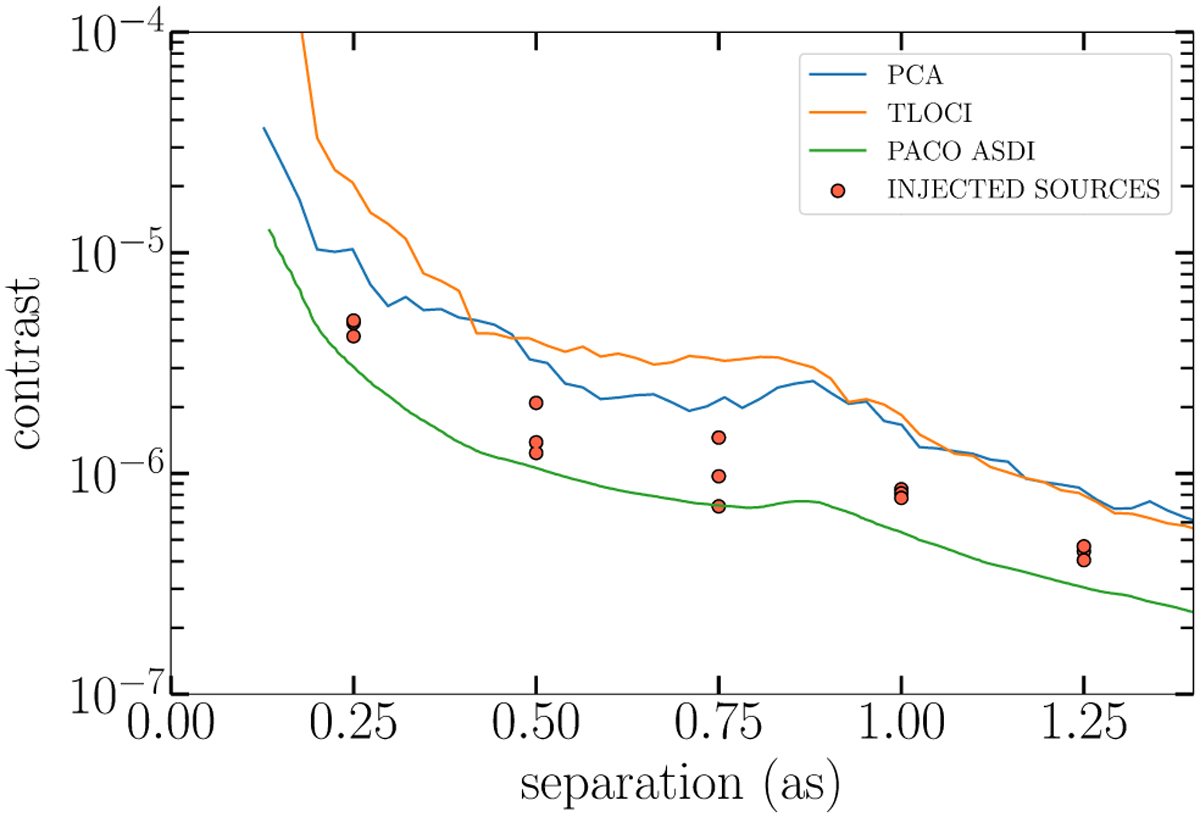
Fig. 11
Download original image
Comparison of the contrast curves at 5σ obtained with PCA (5 modes), TLOCI, and PACO-flat for IRDIS on HD 377. The contrasts of the injected fake planets were computed using 2D contrast maps, thus, there are differences seen with the 5σ curve: local variations of the achieved contrast are averaged azimuthally.
Current usage metrics show cumulative count of Article Views (full-text article views including HTML views, PDF and ePub downloads, according to the available data) and Abstracts Views on Vision4Press platform.
Data correspond to usage on the plateform after 2015. The current usage metrics is available 48-96 hours after online publication and is updated daily on week days.
Initial download of the metrics may take a while.