Open Access
Fig. A.2
Download original image
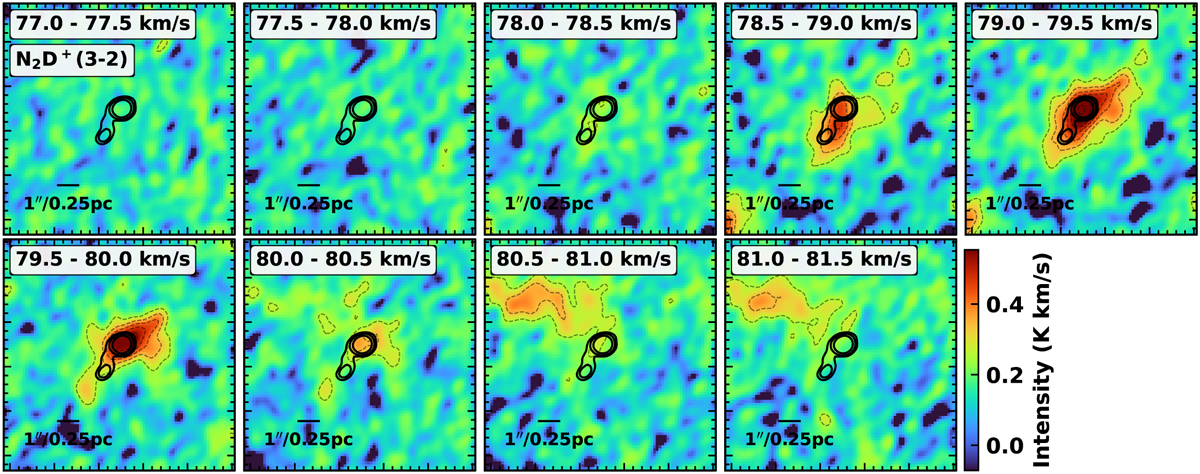
Channel maps of the N2D+ (3−2) emission across the core region. Overlaid as contours is the ALMA 1 mm dust continuum at 0.3″ resolution (see Fig. 1). A scale bar is shown in the lower left of all panels.
Current usage metrics show cumulative count of Article Views (full-text article views including HTML views, PDF and ePub downloads, according to the available data) and Abstracts Views on Vision4Press platform.
Data correspond to usage on the plateform after 2015. The current usage metrics is available 48-96 hours after online publication and is updated daily on week days.
Initial download of the metrics may take a while.