Fig. 4
Download original image
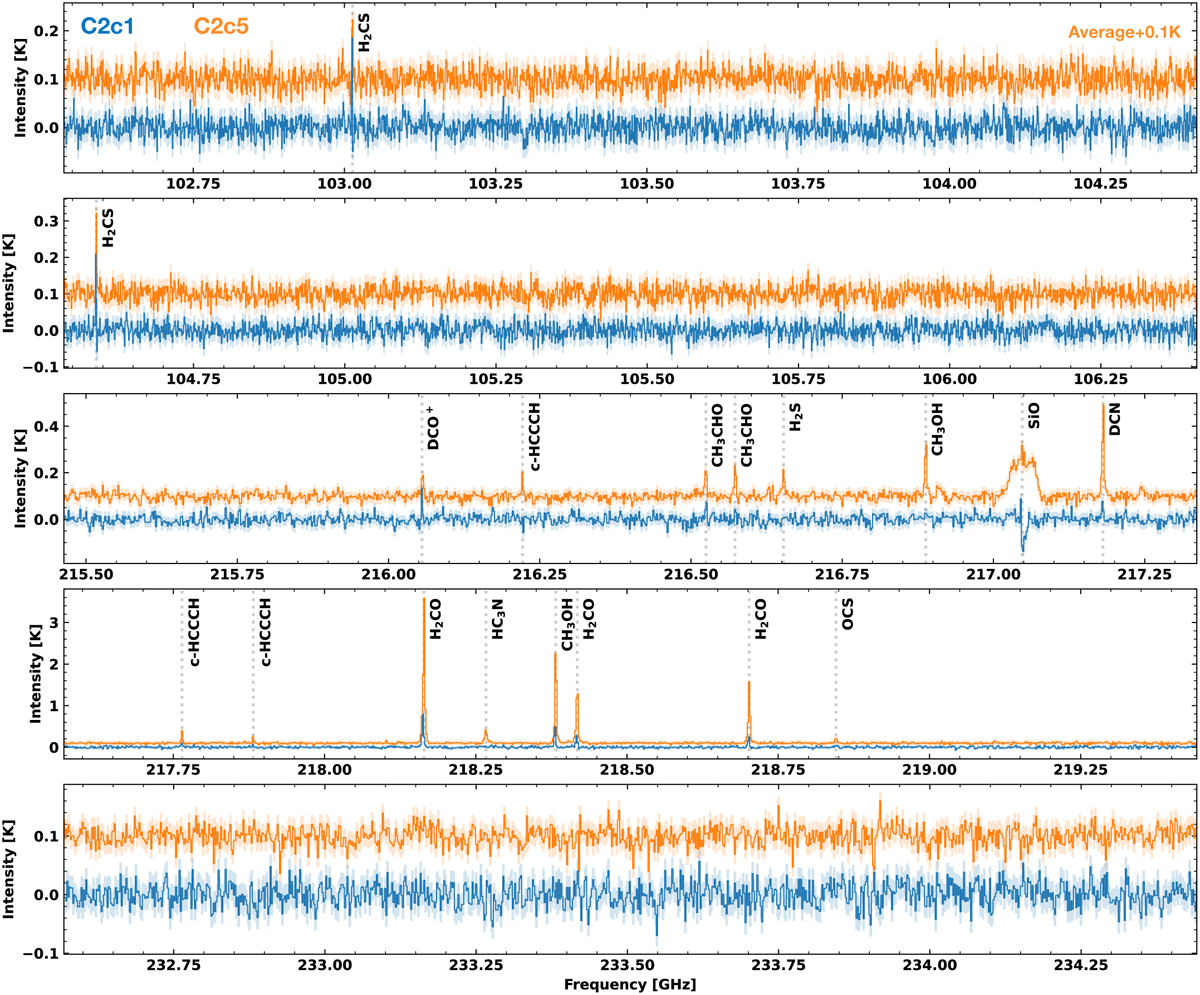
Spectrum taken across the 3 mm (Barnes et al. 2021) and 1 mm spectral windows towards the C2c1 (blue) and C2c5 (orange) cores. Shown as coloured lines is the spectrum averaged within the boundary of the cores, and the coloured shaded regions indicate the uncertainty (rms). The spectrum of the C2c5 core has been offset by +0.1 K to allow comparison. Several prominent lines within the spectral windows, which are summarised in Table 2, are labelled.
Current usage metrics show cumulative count of Article Views (full-text article views including HTML views, PDF and ePub downloads, according to the available data) and Abstracts Views on Vision4Press platform.
Data correspond to usage on the plateform after 2015. The current usage metrics is available 48-96 hours after online publication and is updated daily on week days.
Initial download of the metrics may take a while.