Fig. 3
Download original image
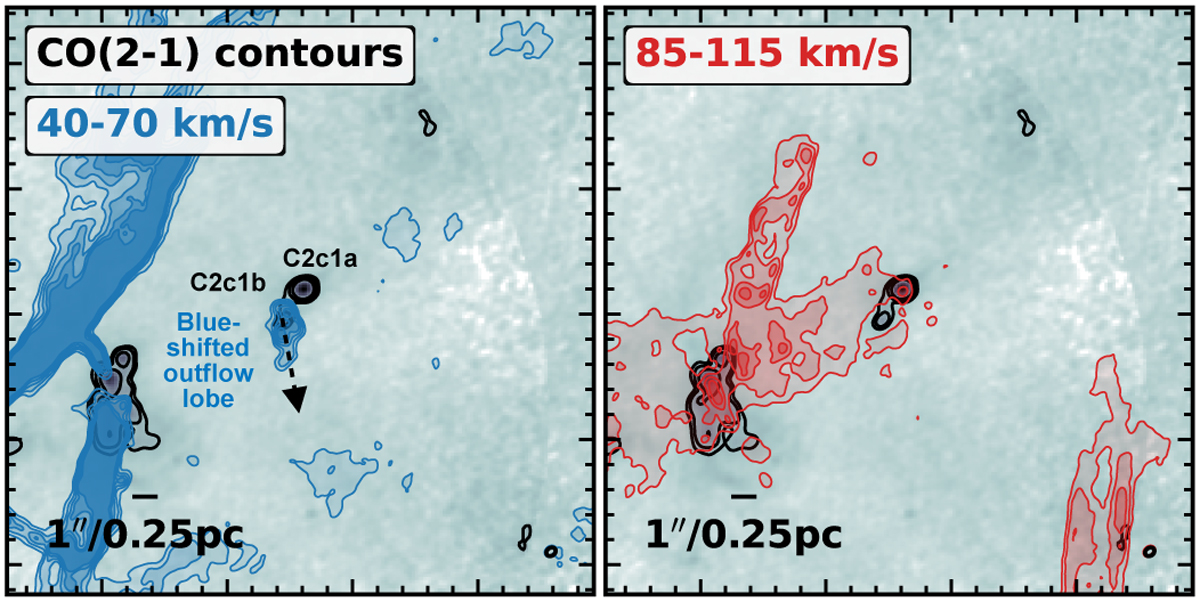
Evidence for a molecular outflow towards the core. We show in contours the CO (2–1) emission integrated in the ranges 40–70 km s−1 (blue contours) and 85–115 km s−1 (red contours). The background grey-scale image shown in both panels is the 1 mm continuum emission (see Fig. 1). Highlighted is the associated blueshifted outflow lobe (no redshifted lobe is obvious due to line-of-sight contamination at higher velocities). Shown in the bottom right is the beam size of the observations. Figure B.1 shows channel maps of the CO emission across the region.
Current usage metrics show cumulative count of Article Views (full-text article views including HTML views, PDF and ePub downloads, according to the available data) and Abstracts Views on Vision4Press platform.
Data correspond to usage on the plateform after 2015. The current usage metrics is available 48-96 hours after online publication and is updated daily on week days.
Initial download of the metrics may take a while.