Fig. 2
Download original image
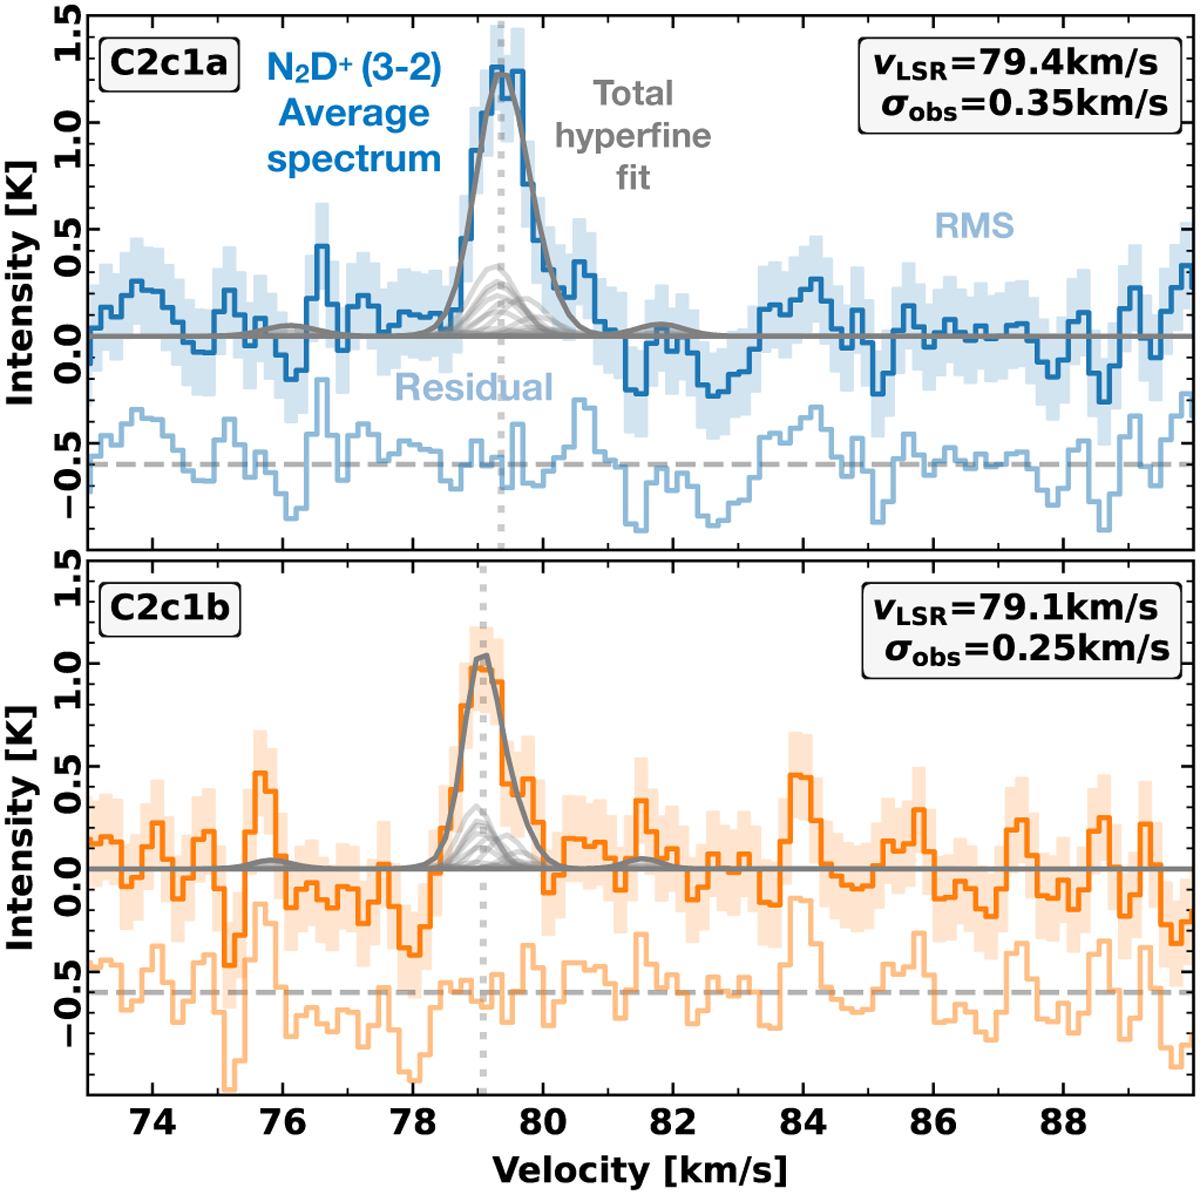
Spectrum of N2D+ (3–2) towards C2c1a (upper panel) and C2c1b (bottom panel). Shown as coloured lines is the spectrum averaged within the boundary of the cores (see Fig. 1), and the coloured shaded regions indicate the uncertainty (rms). Shown in grey is the N2D+ (3–2) hyper-fine fit to the spectrum assuming optically thin (τ = 0.1) conditions (faded grey curves show the individual hyperfine components of the fit), with the fit parameters shown in the upper right of each panel. The faded spectrum below each profile is the residual of the fit (offset by −0.6 K). Figures A.1 and A.2 show moment and channel maps of the N2D+ (3–2) emission across the region, respectively.
Current usage metrics show cumulative count of Article Views (full-text article views including HTML views, PDF and ePub downloads, according to the available data) and Abstracts Views on Vision4Press platform.
Data correspond to usage on the plateform after 2015. The current usage metrics is available 48-96 hours after online publication and is updated daily on week days.
Initial download of the metrics may take a while.