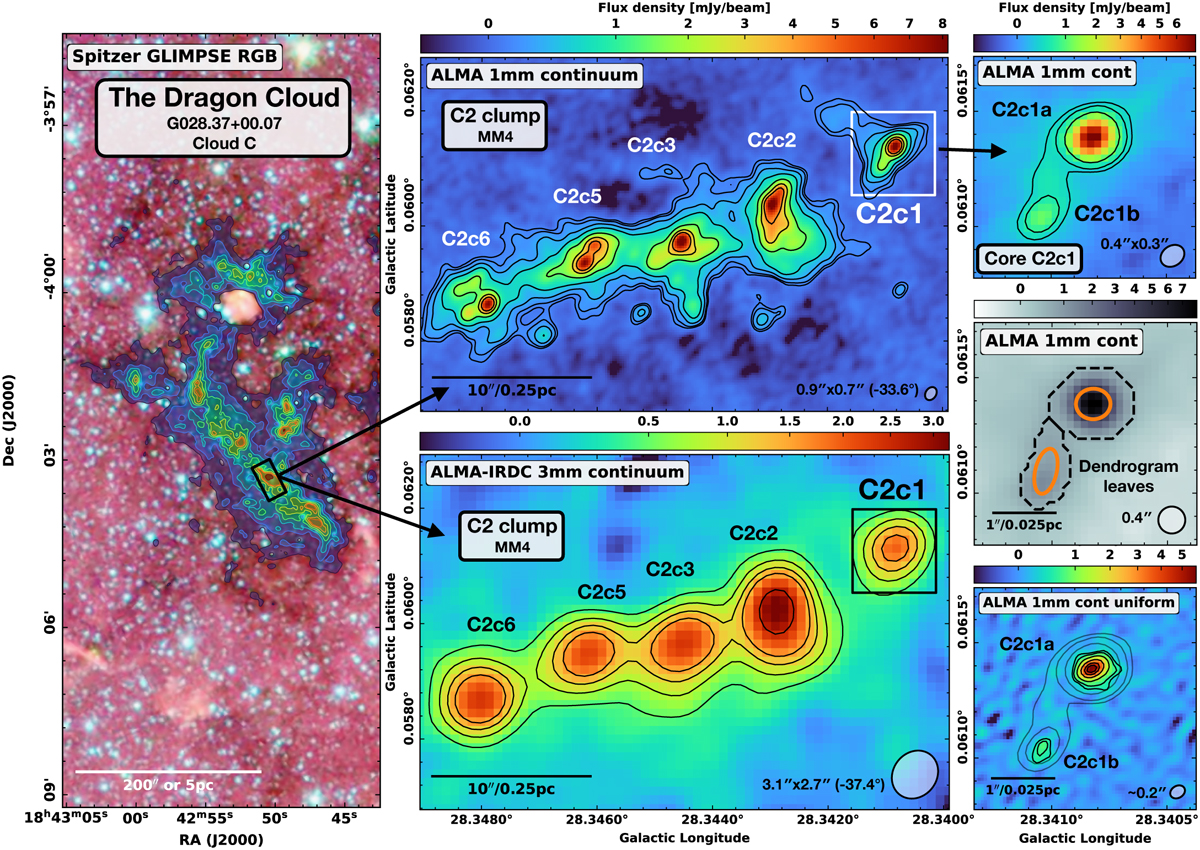
Fig. 1
Download original image
Overview of the dragon cloud (also known as G028.37+00.07 or Cloud C), the C2 clump (also known as MM4), and the C2cl core region. Left: Three-colour image of the Galactic plane in which the IRDC Cloud C can be seen as a strong dark extinction feature. In this image, red is 8 µm, green is 5.8 µm, and blue is 4.5 µm emission from the Spitzer GLIMPSE survey (Churchwell et al. 2009). Overlaid as coloured contours is the combined near- and mid-infrared extinction-derived mass surface density map, in levels of 0.1, 0.15, 0.2, 0.25, 0.3, 0.35, 0.375, and 0.45 g cm−2 (Kainulainen & Tan 2013). Center top: ALMA 1 mm dust continuum at 0.8″ resolution (Liu et al. 2020), overlaid with contours of 0.084, 0.14, 0.28, 0.56, 1.4, 2.8, and 4.2 mJy beam−1. Centre bottom: ALMA 3 mm dust continuum taken from ALMA-IRDC at 3″ resolution (Barnes et al. 2021), overlaid with contours of 0.49, 0.81, 1.13, 1.46, and 2.43 mJy beam−1. Right top: Zoom in on the high-resolution 1 mm continuum image taken with only the longest baseline configuration, overlaid with contours of 0.4, 0.6, and 1.2 mJy beam−1. Right center: ALMA 1 mm dust continuum with a circularised 0.4″ beam, which was used for the dendrogram analysis. The dashed black contours indicate the boundaries of the identified cores, whilst the orange ellipses show the intensity-weighted second moment along the two spatial dimensions within the contour (e.g. Rosolowsky et al. 2008). Right bottom: Same 1 mm observations imaged with a robust −2 (close to uniform) weighting scheme to maximise the resolution (0.24″ × 0.19″, or ~0.05 pc), overlaid with contours of 0.4, 0.6, 1.2, 2.5, 4, and 5 mJy beam−1 (solid black line). Shown on the right of the ALMA observation panels is the beam size, and a scale bar is shown in the lower left of all panels.
Current usage metrics show cumulative count of Article Views (full-text article views including HTML views, PDF and ePub downloads, according to the available data) and Abstracts Views on Vision4Press platform.
Data correspond to usage on the plateform after 2015. The current usage metrics is available 48-96 hours after online publication and is updated daily on week days.
Initial download of the metrics may take a while.