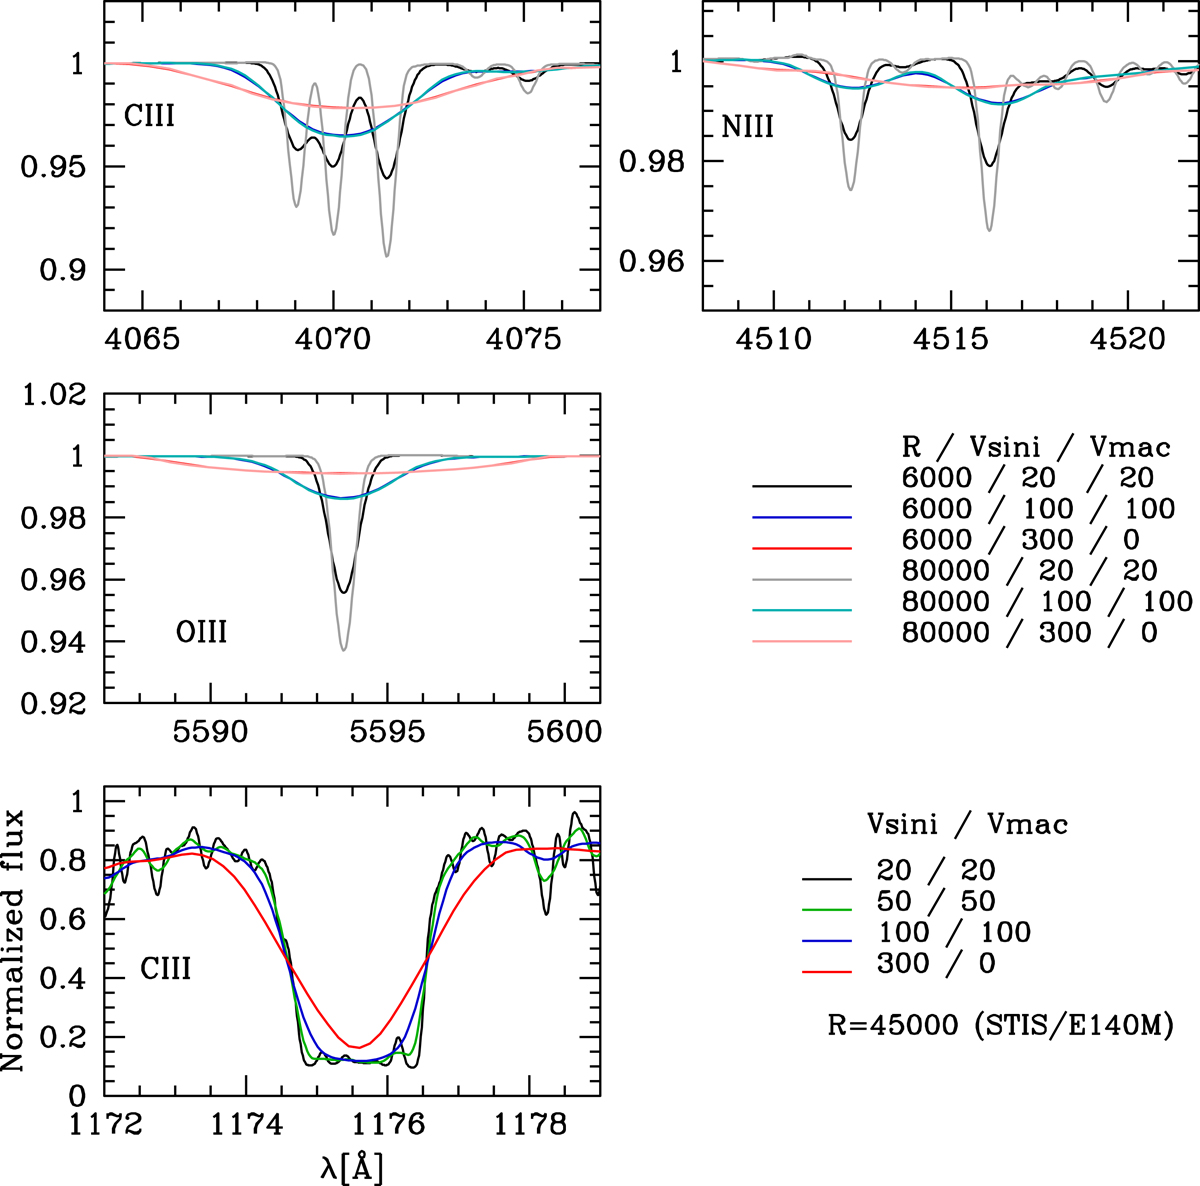
Fig. 5.
Download original image
Effect of spectral resolution and rotational velocity on three sets of optical lines classically used to determine C, N, and O abundances. In each panel, the initial CMFGEN model has Teff = 31 000 K, log g = 3.6 and 0.2 Z⊙. The model is degraded to a resolution of either 6000 (typical for our X-shooter UVB spectra) or 80 000 and further convolved with three rotational velocities (20, 100, and 300 km s−1). No additional macro-turbulent broadening is considered. Also plotted is the UV C III 1176 line. Here the spectral resolution is that of the STIS E140M grating (R ∼ 45 000).
Current usage metrics show cumulative count of Article Views (full-text article views including HTML views, PDF and ePub downloads, according to the available data) and Abstracts Views on Vision4Press platform.
Data correspond to usage on the plateform after 2015. The current usage metrics is available 48-96 hours after online publication and is updated daily on week days.
Initial download of the metrics may take a while.