Fig. 9.
Download original image
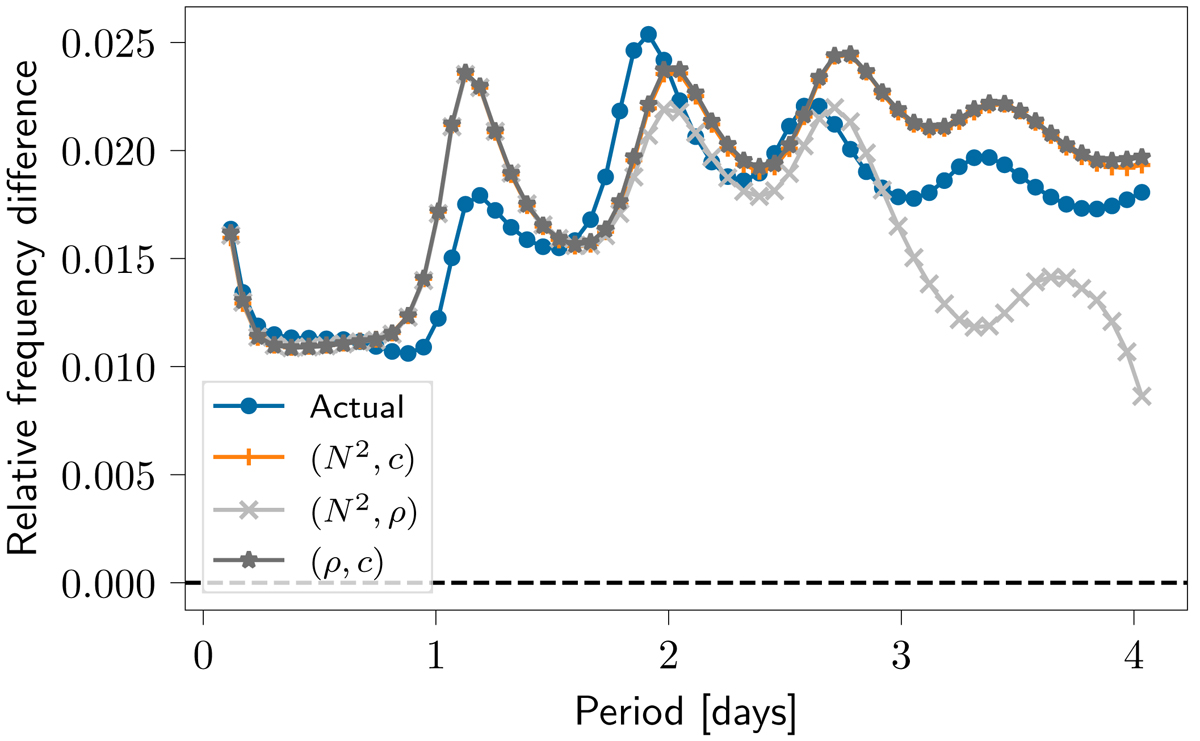
Predictions of the frequency differences between the reference model and the closest target model, target model #1. The dark blue circles show the actual difference as computed using GYRE. The three other types of points are computed using the oscillation kernels for the variable pairs (N2, c), (N2, ρ) and (ρ, c). While the (ρ, c) and (N2, c) variable pairs agree with each other, the (N2, ρ) variable pair shows significant deviations.
Current usage metrics show cumulative count of Article Views (full-text article views including HTML views, PDF and ePub downloads, according to the available data) and Abstracts Views on Vision4Press platform.
Data correspond to usage on the plateform after 2015. The current usage metrics is available 48-96 hours after online publication and is updated daily on week days.
Initial download of the metrics may take a while.