Fig. 7.
Download original image
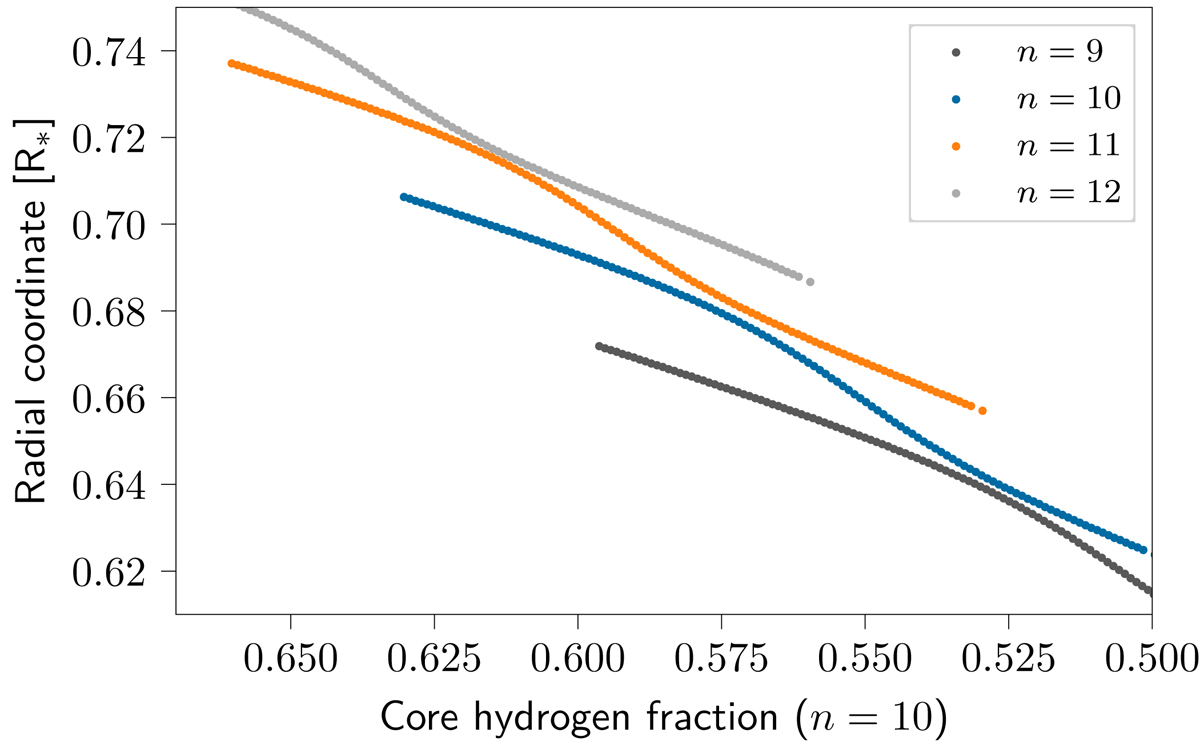
Evolution of the location of the nodes closest to the surface of the n = 9, 10, 11 and 12 modes. In order to increase visual clarity, the nodes of the n = 9, 11 and 12 modes have been shifted by values of 0.034, −0.030 and −0.060 in core hydrogen fraction. This aligns the modes before and after the avoided crossing, as in Fig. 6. Immediately after the first cascade of avoided crossings, the n = 12 mode has settled in at the position of the n = 11 mode just before the cascade, the n = 11 mode at the position of the n = 10 mode and finally the n = 10 mode at the position of the n = 9 mode.
Current usage metrics show cumulative count of Article Views (full-text article views including HTML views, PDF and ePub downloads, according to the available data) and Abstracts Views on Vision4Press platform.
Data correspond to usage on the plateform after 2015. The current usage metrics is available 48-96 hours after online publication and is updated daily on week days.
Initial download of the metrics may take a while.