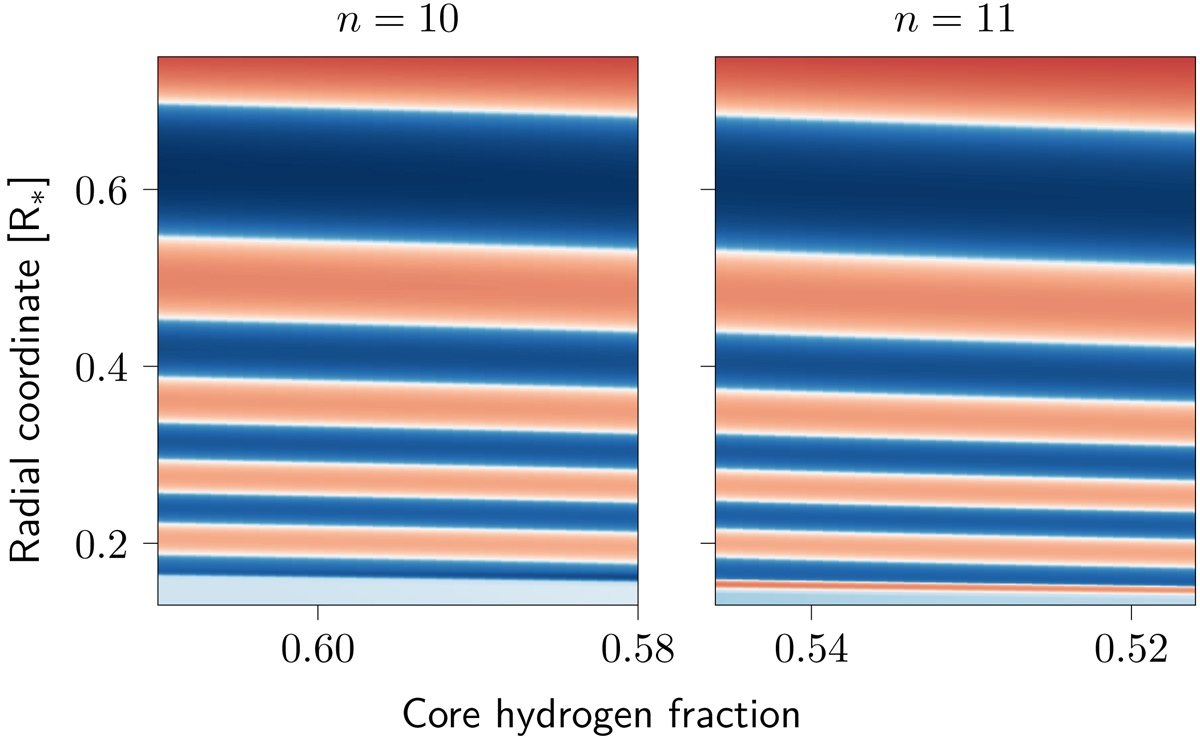
Fig. 6.
Download original image
Slices of the evolution of the n = 10 and n = 11 g modes of the reference model, as in Fig. 5, but now plotted with logarithmic amplitude. The left panel shows the n = 10 mode before its avoided crossing with the n = 11 mode, while the right panel shows the n = 11 mode after its avoided crossing with the n = 10 mode. This shows that the structure of the n = 10 mode before the crossing is similar to the n = 11 mode after the crossing, with the exception of an additional node near the core of the star.
Current usage metrics show cumulative count of Article Views (full-text article views including HTML views, PDF and ePub downloads, according to the available data) and Abstracts Views on Vision4Press platform.
Data correspond to usage on the plateform after 2015. The current usage metrics is available 48-96 hours after online publication and is updated daily on week days.
Initial download of the metrics may take a while.