Fig. 5.
Download original image
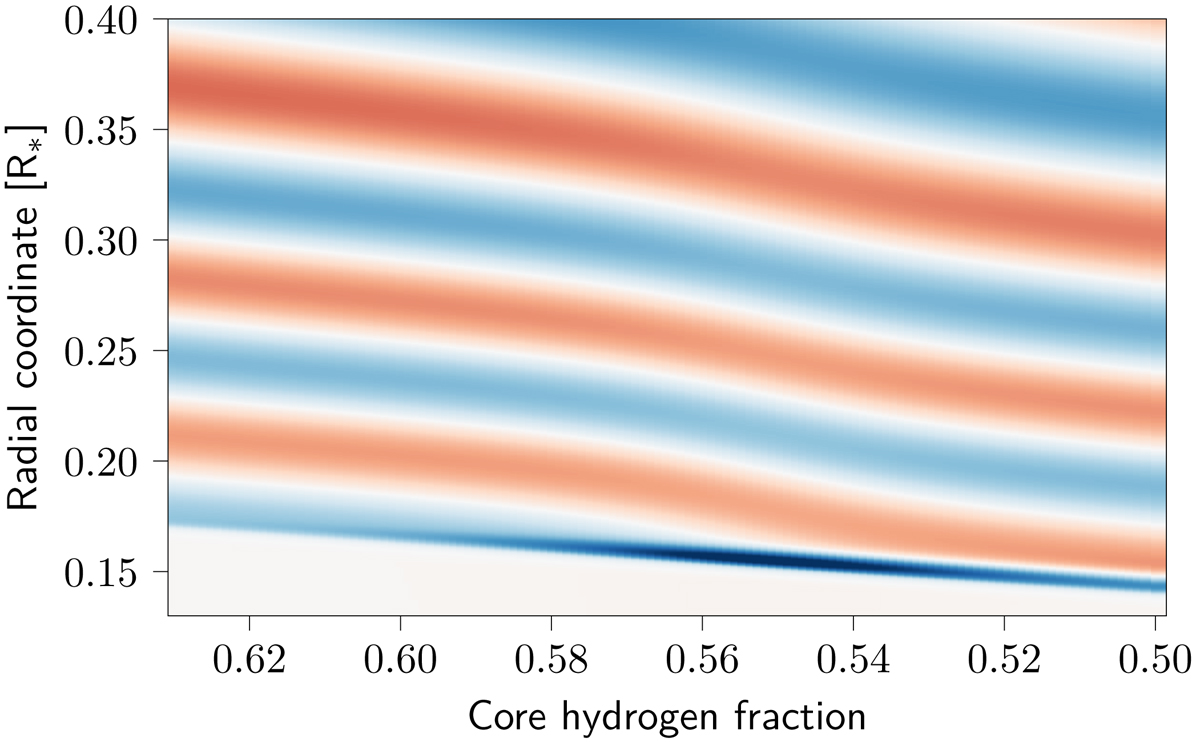
Evolution of the horizontal displacement of the n = 10 g mode of the evolutionary track containing the reference model. The colors and intensity indicate the sign and amplitude of the displacement. Since the oscillation equations are linear and homogeneous, the absolute magnitude and overall sign are not relevant. Around Xc = 0.56 the mode undergoes avoided crossings with the n = 11 and n = 9 modes, causing strong changes in the structure of the mode.
Current usage metrics show cumulative count of Article Views (full-text article views including HTML views, PDF and ePub downloads, according to the available data) and Abstracts Views on Vision4Press platform.
Data correspond to usage on the plateform after 2015. The current usage metrics is available 48-96 hours after online publication and is updated daily on week days.
Initial download of the metrics may take a while.