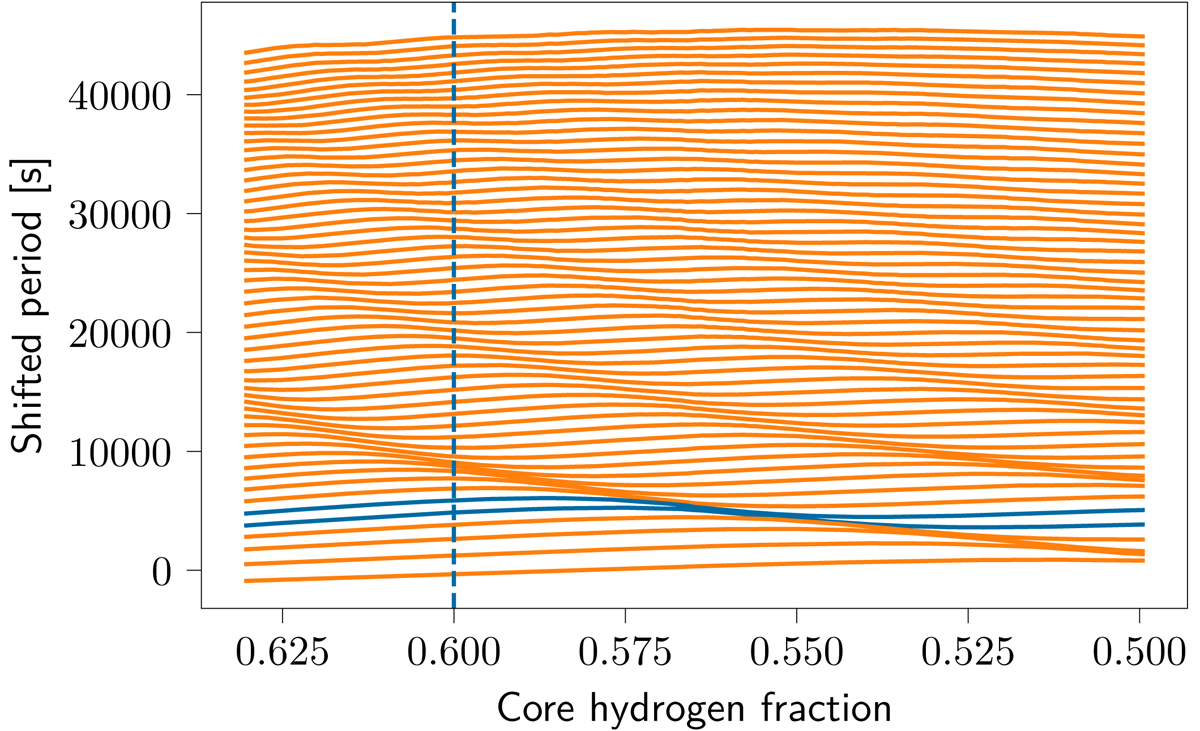
Fig. 4.
Download original image
Evolution of the periods of the oscillation modes of the evolutionary track containing the reference model. The periods have been shifted by −n5000 s, where n is the radial order of the mode, so that the change in mode periods is more pronounced. Radial orders n = 6 to n = 60 (from bottom to top) have been plotted. The two modes highlighted in blue are the n = 10 and n = 11 modes shown in Fig. 6. The denser regions show where the dips in the period-spacing patterns are and how they evolve as the star ages. Where these avoided crossings are located is strongly dependent on the size and location of the buoyancy frequency peak and we can therefore learn about the near-core mixing processes from them. The vertical dashed line indicates the reference model.
Current usage metrics show cumulative count of Article Views (full-text article views including HTML views, PDF and ePub downloads, according to the available data) and Abstracts Views on Vision4Press platform.
Data correspond to usage on the plateform after 2015. The current usage metrics is available 48-96 hours after online publication and is updated daily on week days.
Initial download of the metrics may take a while.