Open Access
Fig. 3.
Download original image
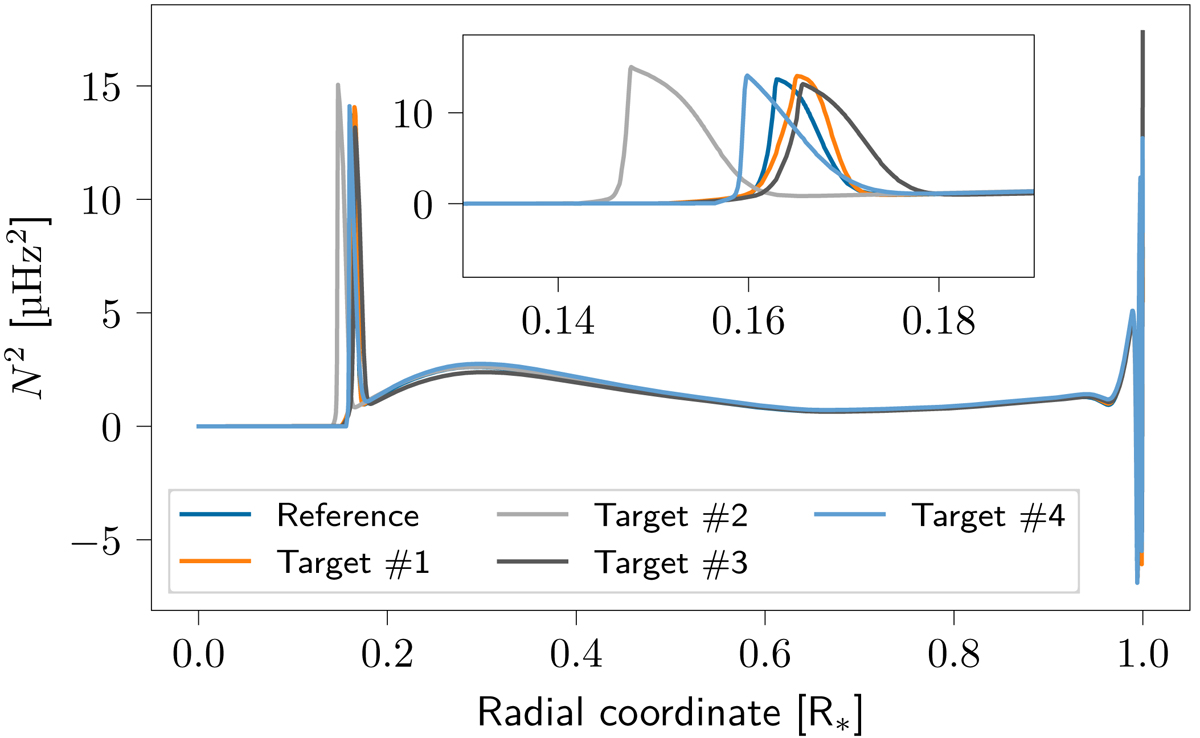
Squared buoyancy frequency of the different target models. The peaks around 0.16 R* show where the transition from the envelope of the star to the core takes place and is the dominant factor in determining the period-spacing pattern.
Current usage metrics show cumulative count of Article Views (full-text article views including HTML views, PDF and ePub downloads, according to the available data) and Abstracts Views on Vision4Press platform.
Data correspond to usage on the plateform after 2015. The current usage metrics is available 48-96 hours after online publication and is updated daily on week days.
Initial download of the metrics may take a while.