Fig. C.4.
Download original image
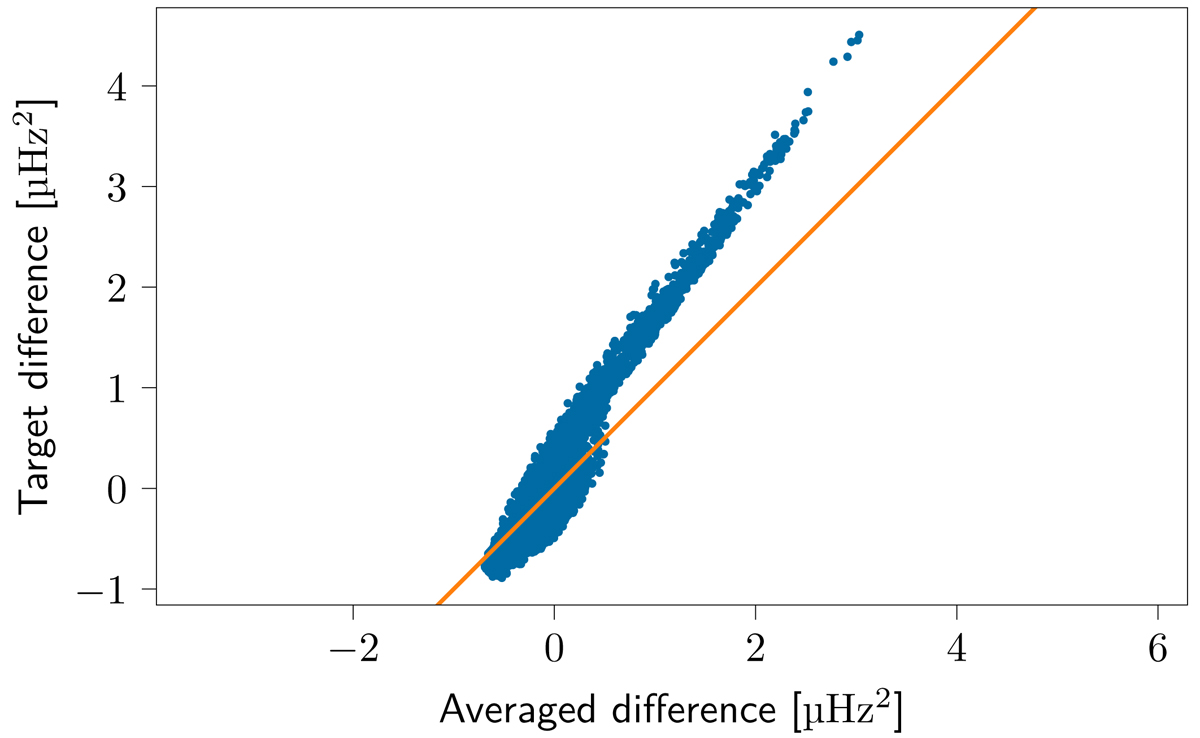
Quality of the averaging kernel for the n = 1 − 60 averaging kernel from Fig. C.3. The x axis shows the difference between the reference model and the 2880 target models averaged by the averaging kernel, while the y axis shows the same difference averaged by the target kernel. The closer the points lie to the y = x line (in orange), the better the averaging kernel matches the target kernel. The numbers indicate the different target models.
Current usage metrics show cumulative count of Article Views (full-text article views including HTML views, PDF and ePub downloads, according to the available data) and Abstracts Views on Vision4Press platform.
Data correspond to usage on the plateform after 2015. The current usage metrics is available 48-96 hours after online publication and is updated daily on week days.
Initial download of the metrics may take a while.