Fig. C.1.
Download original image
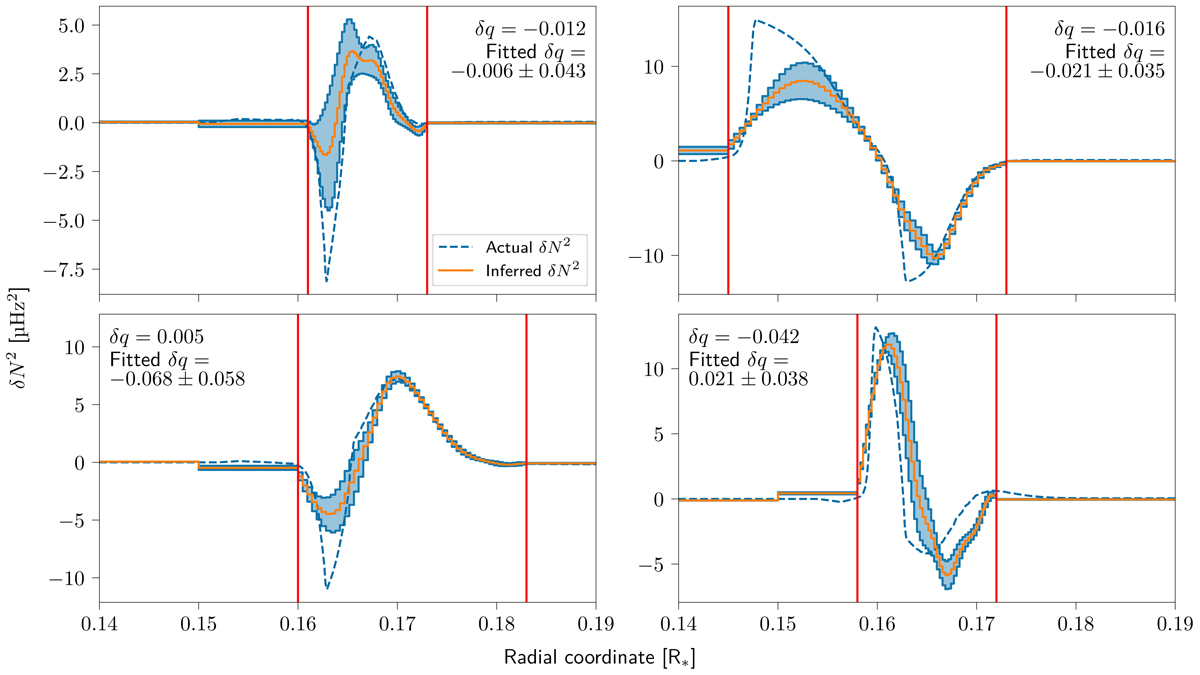
Structure inversions of the four target models using RLS, relying on oscillation modes with n = 10 − 50. The inferred buoyancy frequency difference is shown in orange (full line) and the difference between the models in blue (dashed line). The observational uncertainty is indicated by the light blue regions around the inferred profile. The inferred profile is discretized in 70 grid points, of which 50 are located in regions of the largest difference in buoyancy frequency, indicated by the red lines. The first row contains target models #1 and #2, while the second row contains target models #3 and #4. As in Fig. 13, the difference in oscillation frequencies between the target models is computed from the difference in structure and the kernels.
Current usage metrics show cumulative count of Article Views (full-text article views including HTML views, PDF and ePub downloads, according to the available data) and Abstracts Views on Vision4Press platform.
Data correspond to usage on the plateform after 2015. The current usage metrics is available 48-96 hours after online publication and is updated daily on week days.
Initial download of the metrics may take a while.