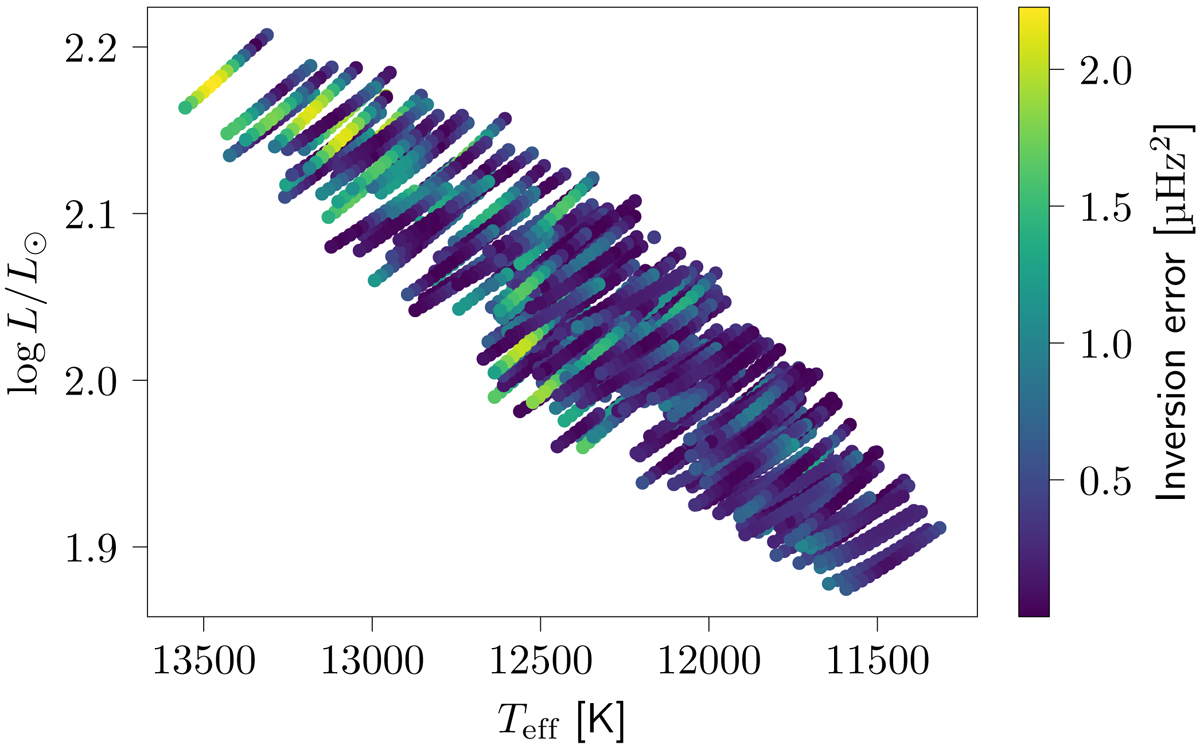
Fig. 17.
Download original image
Location of the evolutionary models in an HRD, as in Fig. 1. Each colored circle is one of the 2880 stellar models, forming 192 evolutionary tracks. The colors indicate the error on the inversion. No significant correlation can be seen between the errors on the inferred difference in structure and the position of the model in an HRD. We note that the tracks overlap in this figure, hence the color at location of the target models is not necessarily representative of the reference models themselves.
Current usage metrics show cumulative count of Article Views (full-text article views including HTML views, PDF and ePub downloads, according to the available data) and Abstracts Views on Vision4Press platform.
Data correspond to usage on the plateform after 2015. The current usage metrics is available 48-96 hours after online publication and is updated daily on week days.
Initial download of the metrics may take a while.