Fig. 16.
Download original image
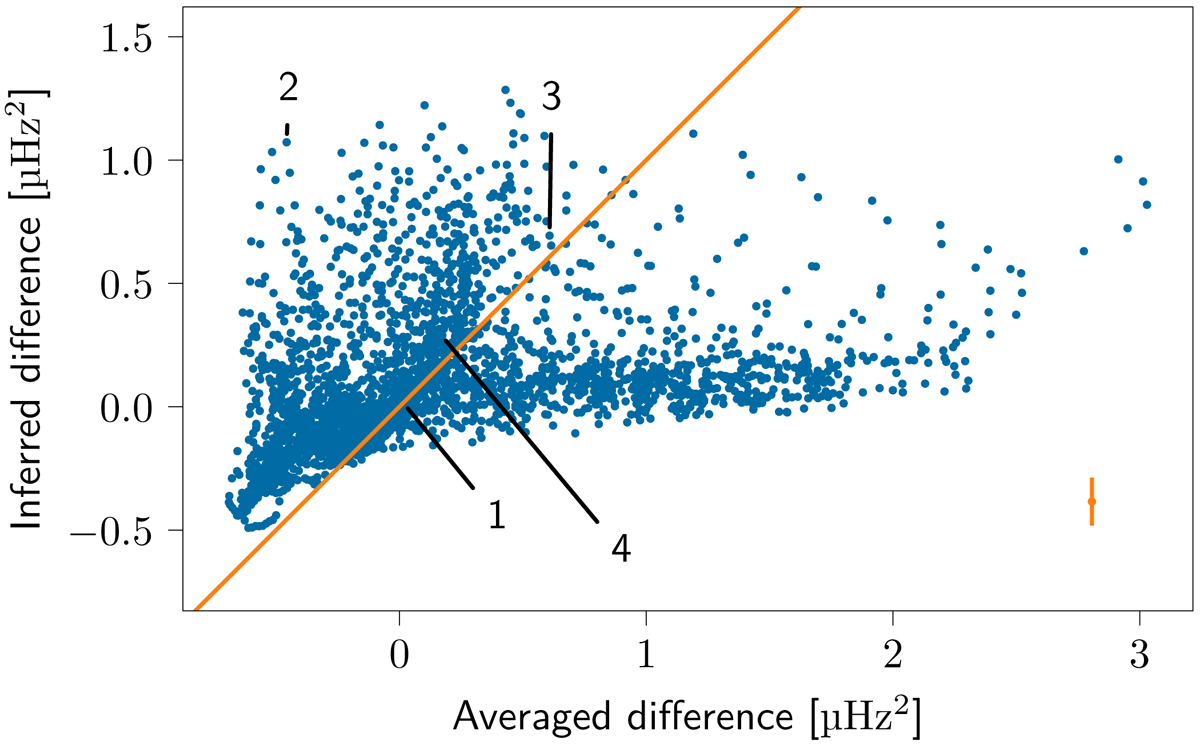
Comparison of the actual difference in structure to the inferred difference for the averaging kernel in Fig. 15. The values on the x- and y-axis are differences in squared buoyancy frequency. The x-axis shows the integral of the structure difference multiplied by the averaging kernel (the integral in Eq. (10)), while the y-axis shows the inversion result (the left hand side of Eq. (10)). Each blue dot is one of the 2880 stellar models. The orange diagonal line is given by x = y. All deviations from this line are caused by the nonlinear dependency on the structure. The numbers indicate the different target models. The orange error bar in the lower right corner of the plot indicates the observational uncertainty on the inferred difference, given an uncertainty of 10−3 μHz on the observed frequencies.
Current usage metrics show cumulative count of Article Views (full-text article views including HTML views, PDF and ePub downloads, according to the available data) and Abstracts Views on Vision4Press platform.
Data correspond to usage on the plateform after 2015. The current usage metrics is available 48-96 hours after online publication and is updated daily on week days.
Initial download of the metrics may take a while.