Fig. 12.
Download original image
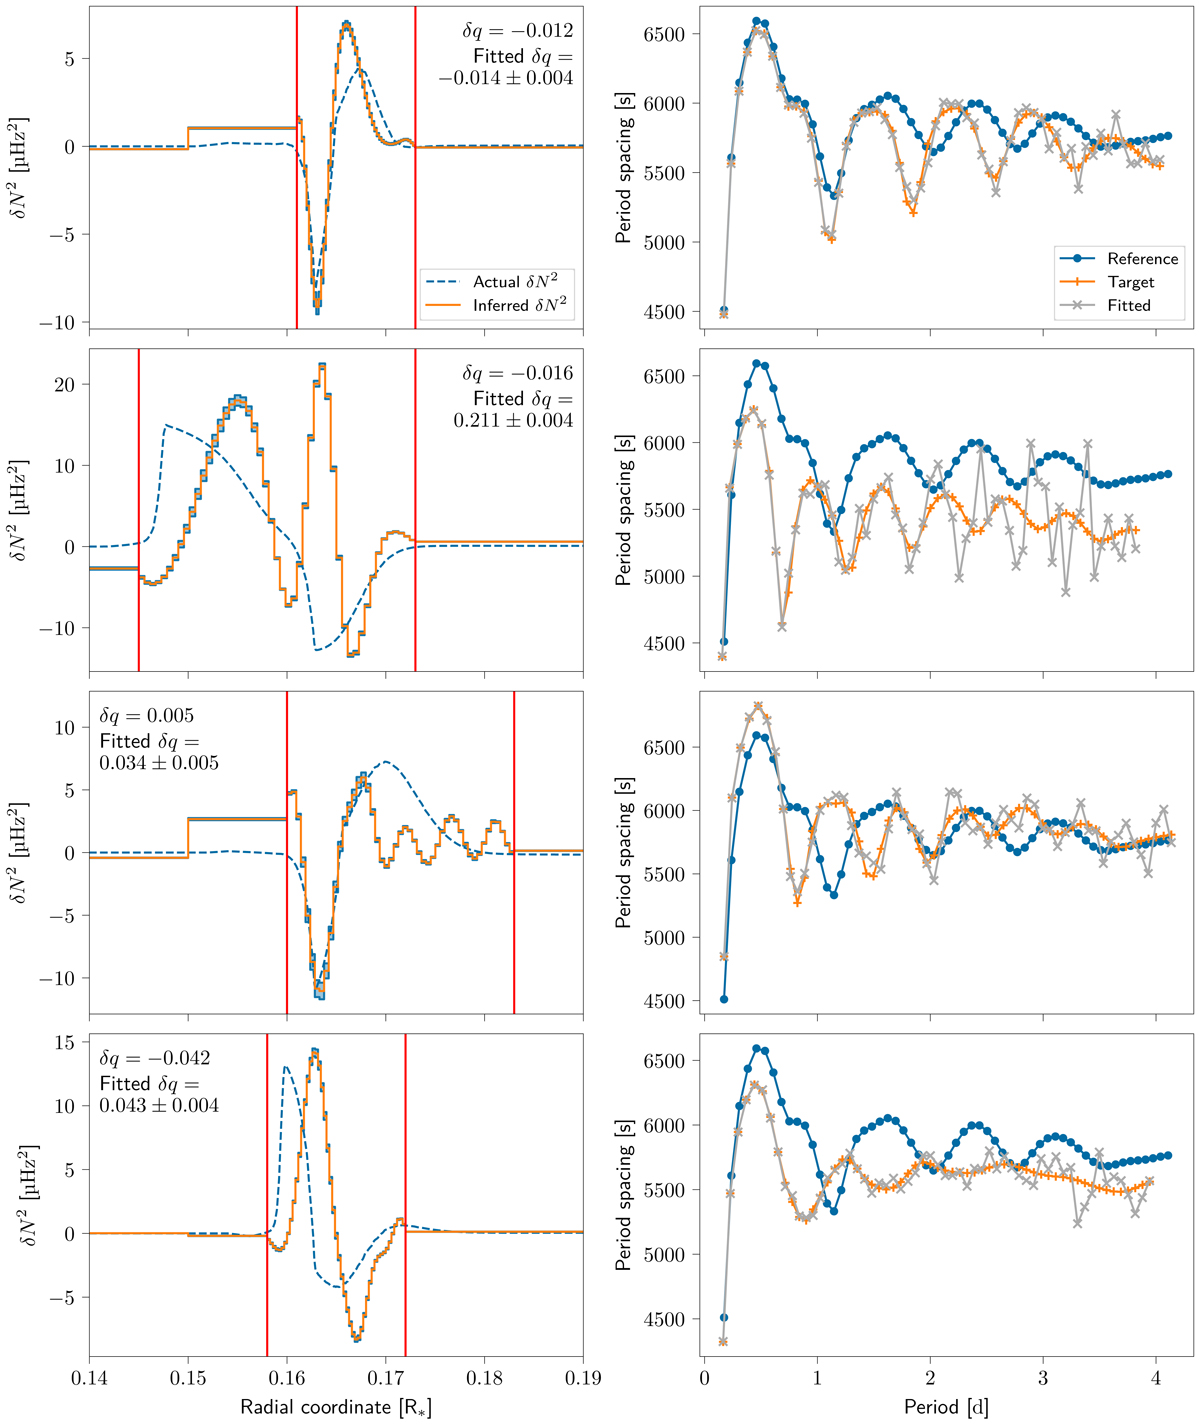
Structure inversions of the four target models using RLS. The left column shows the inferred buoyancy frequency difference (orange full line) and the difference between the models (blue dashed line) for target models #1 to #4 in order. The observational uncertainty is indicated by the light blue regions around the inferred profile. For most of these inferred profiles, the regions are approximately the size of the line width. The right column shows the period-spacing pattern of the reference model (blue circles), the target models (orange plus symbols) and the fitted modes (gray crosses; ![]() defined in Eq. (4)). The inferred profile is discretized in 70 grid points, of which 50 are located in regions of the largest difference in buoyancy frequency, indicated by the red lines. The regularization parameter varies between 10−4.8 and 10−4.2 between the different target models. Except for the closest target model, the inferred profiles show significant deviation from the actual difference between the models. The period-spacing patterns show that the overall quality of the fit is limited, especially at higher radial orders.
defined in Eq. (4)). The inferred profile is discretized in 70 grid points, of which 50 are located in regions of the largest difference in buoyancy frequency, indicated by the red lines. The regularization parameter varies between 10−4.8 and 10−4.2 between the different target models. Except for the closest target model, the inferred profiles show significant deviation from the actual difference between the models. The period-spacing patterns show that the overall quality of the fit is limited, especially at higher radial orders.
Current usage metrics show cumulative count of Article Views (full-text article views including HTML views, PDF and ePub downloads, according to the available data) and Abstracts Views on Vision4Press platform.
Data correspond to usage on the plateform after 2015. The current usage metrics is available 48-96 hours after online publication and is updated daily on week days.
Initial download of the metrics may take a while.