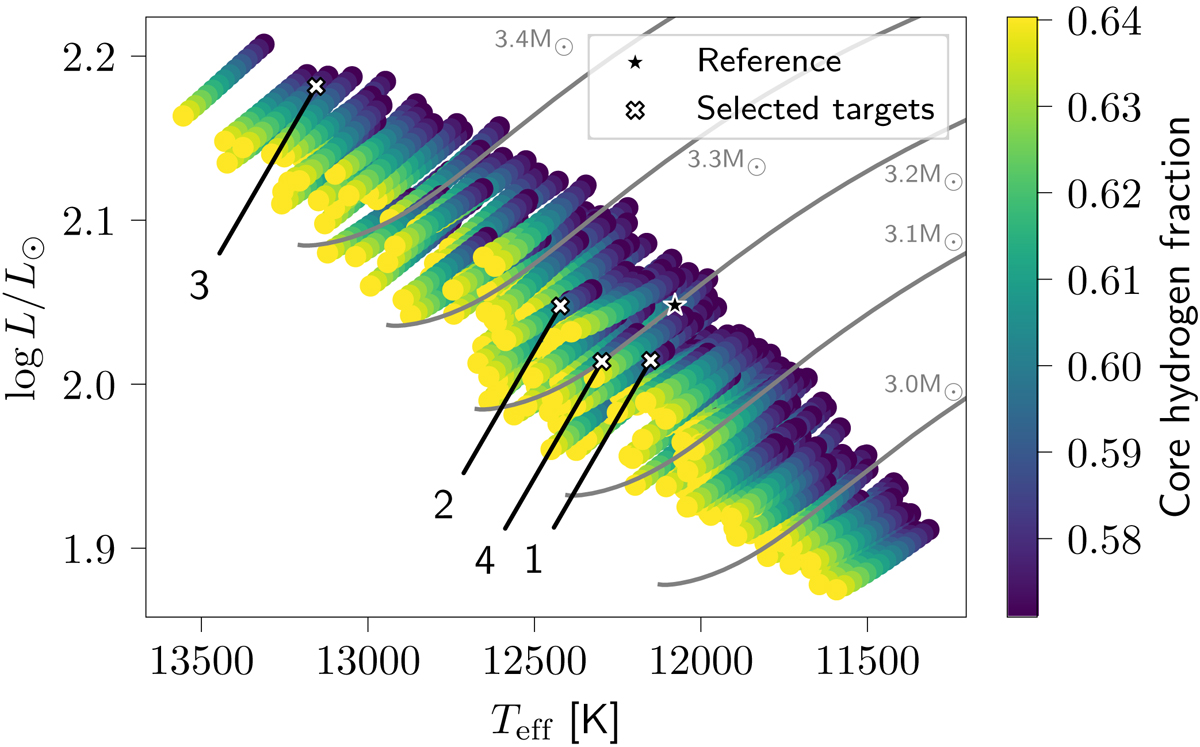
Fig. 1.
Download original image
Location of the evolutionary models in an HRD. Each colored circle is a stellar model, with the color indicating the hydrogen fraction in the core of the model. The reference model used throughout this work is indicated by a black star, while the white crosses are the target models. We refer to the target models by the numbers given in this plot. The gray lines show evolutionary tracks for different masses, with the same metallicity and overshooting parameters as the reference model.
Current usage metrics show cumulative count of Article Views (full-text article views including HTML views, PDF and ePub downloads, according to the available data) and Abstracts Views on Vision4Press platform.
Data correspond to usage on the plateform after 2015. The current usage metrics is available 48-96 hours after online publication and is updated daily on week days.
Initial download of the metrics may take a while.