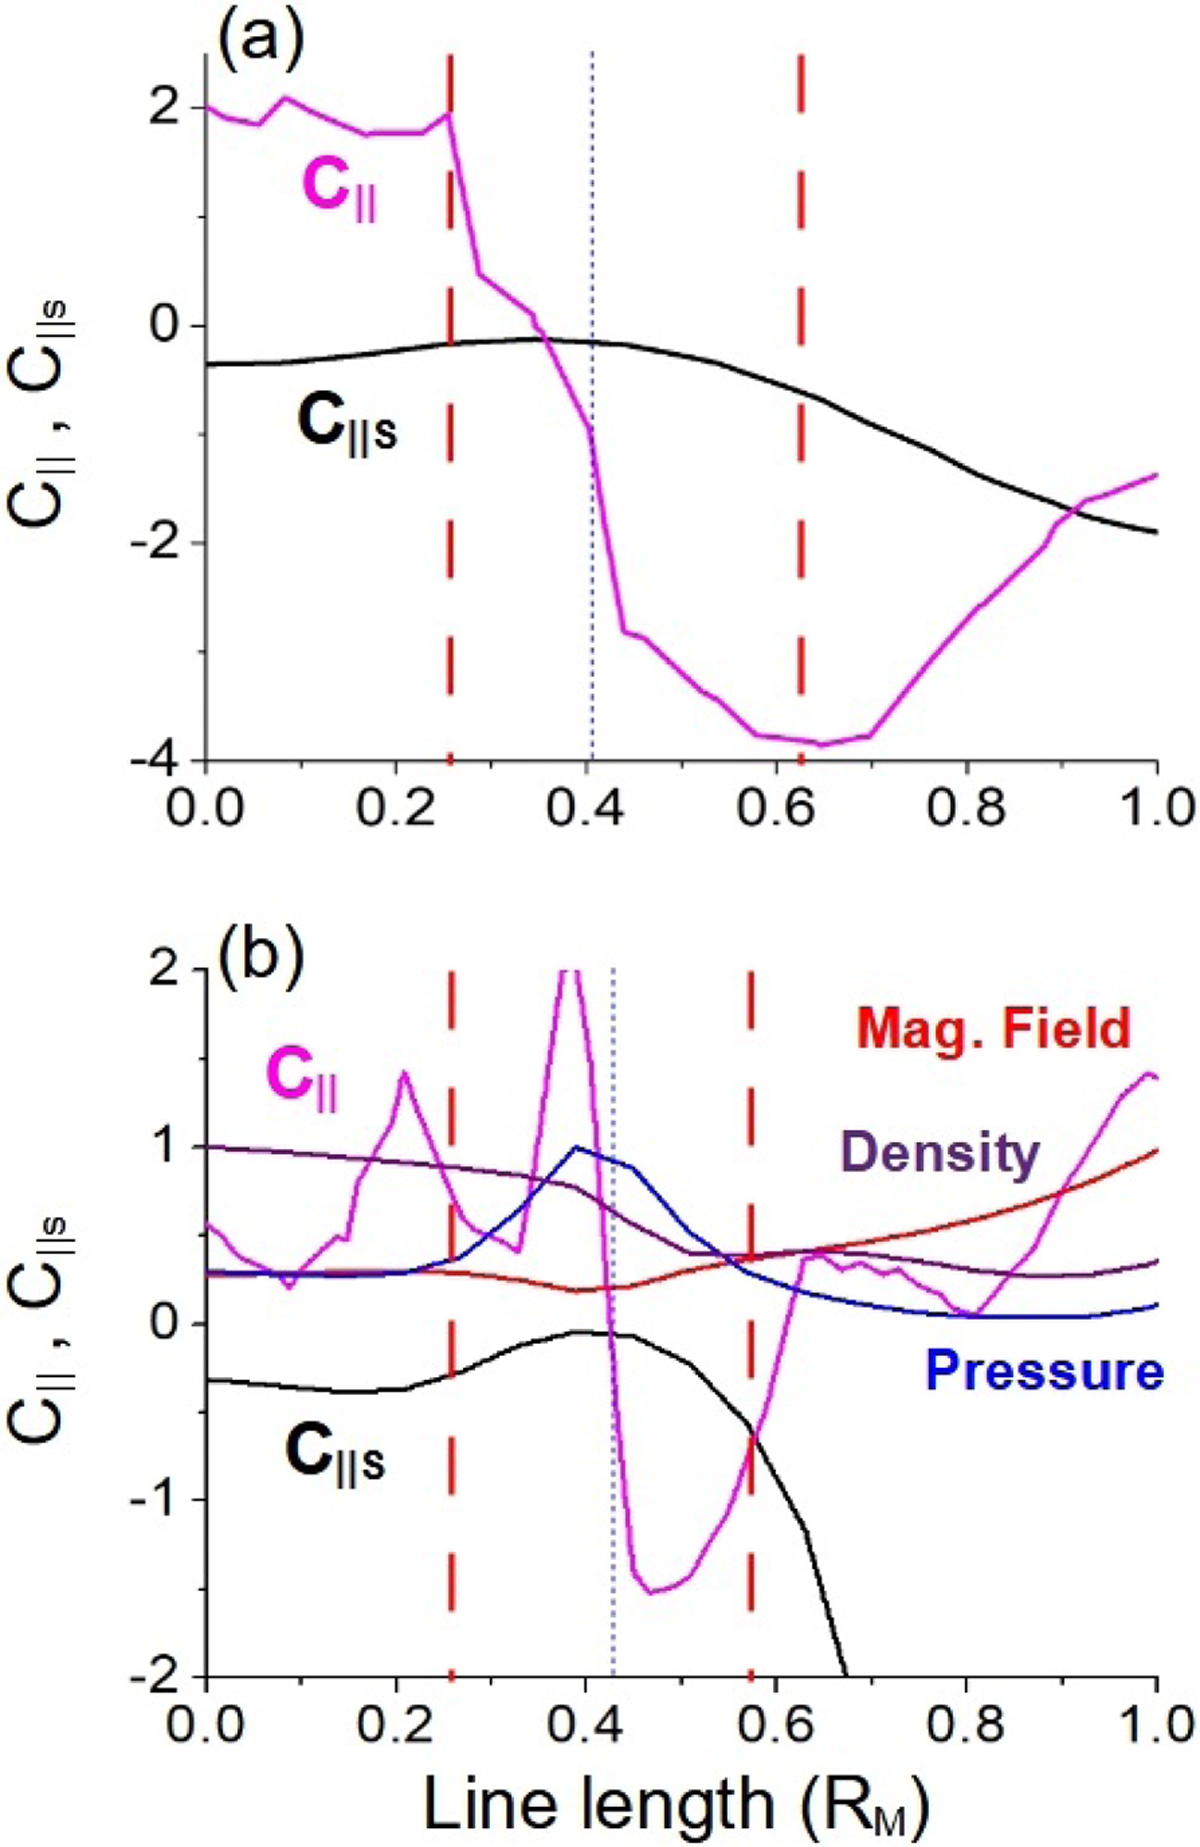
Fig. 7

Download original image
Parallel compressibility (C||, black line) and parallel compressibility (C||S, pink line) calculated using the simulation data. (a) MESSENGER trajectory and (b) straight line indicated in Fig. 3a crossing the local maximum of the plasma pressure inside the SMS. The dashed red lines indicate the region with a putative presence of slow modes (the parallel compressibility becomes negative in the immediate vicinity of the magnetopause). The dotted blue line shows the encounter of the satellite with the compression front. Panel b also includes the normalized values of the magnetic field (red), plasma pressure (blue), and density (purple).
Current usage metrics show cumulative count of Article Views (full-text article views including HTML views, PDF and ePub downloads, according to the available data) and Abstracts Views on Vision4Press platform.
Data correspond to usage on the plateform after 2015. The current usage metrics is available 48-96 hours after online publication and is updated daily on week days.
Initial download of the metrics may take a while.


