Fig. 8.
Download original image
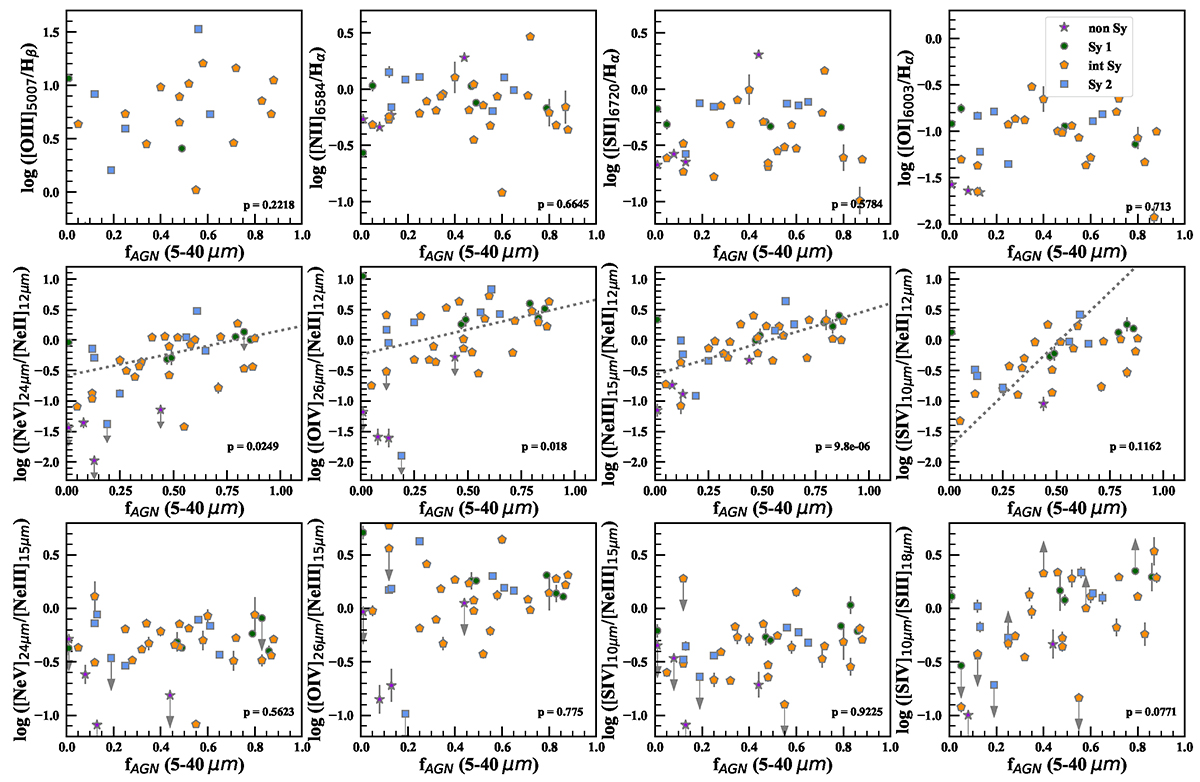
Optical (top panels) and mid-IR (central and bottom panels) line ratios as a function of the fractional contribution of the AGN to the mid-IR (5–40 μm) continuum. Open symbols indicate the classification of the targets: green circles for Sy1, orange pentagons for int-Sy, light blue squares for Sy2, and violet stars for non-Sy. Upper and lower limits are marked with arrows. Each panel reports the p-value from the Spearman analysis at the bottom right. The dotted gray lines are the ODR fit results for the ratios with p-values smaller than 0.05.
Current usage metrics show cumulative count of Article Views (full-text article views including HTML views, PDF and ePub downloads, according to the available data) and Abstracts Views on Vision4Press platform.
Data correspond to usage on the plateform after 2015. The current usage metrics is available 48-96 hours after online publication and is updated daily on week days.
Initial download of the metrics may take a while.