Fig. 6.
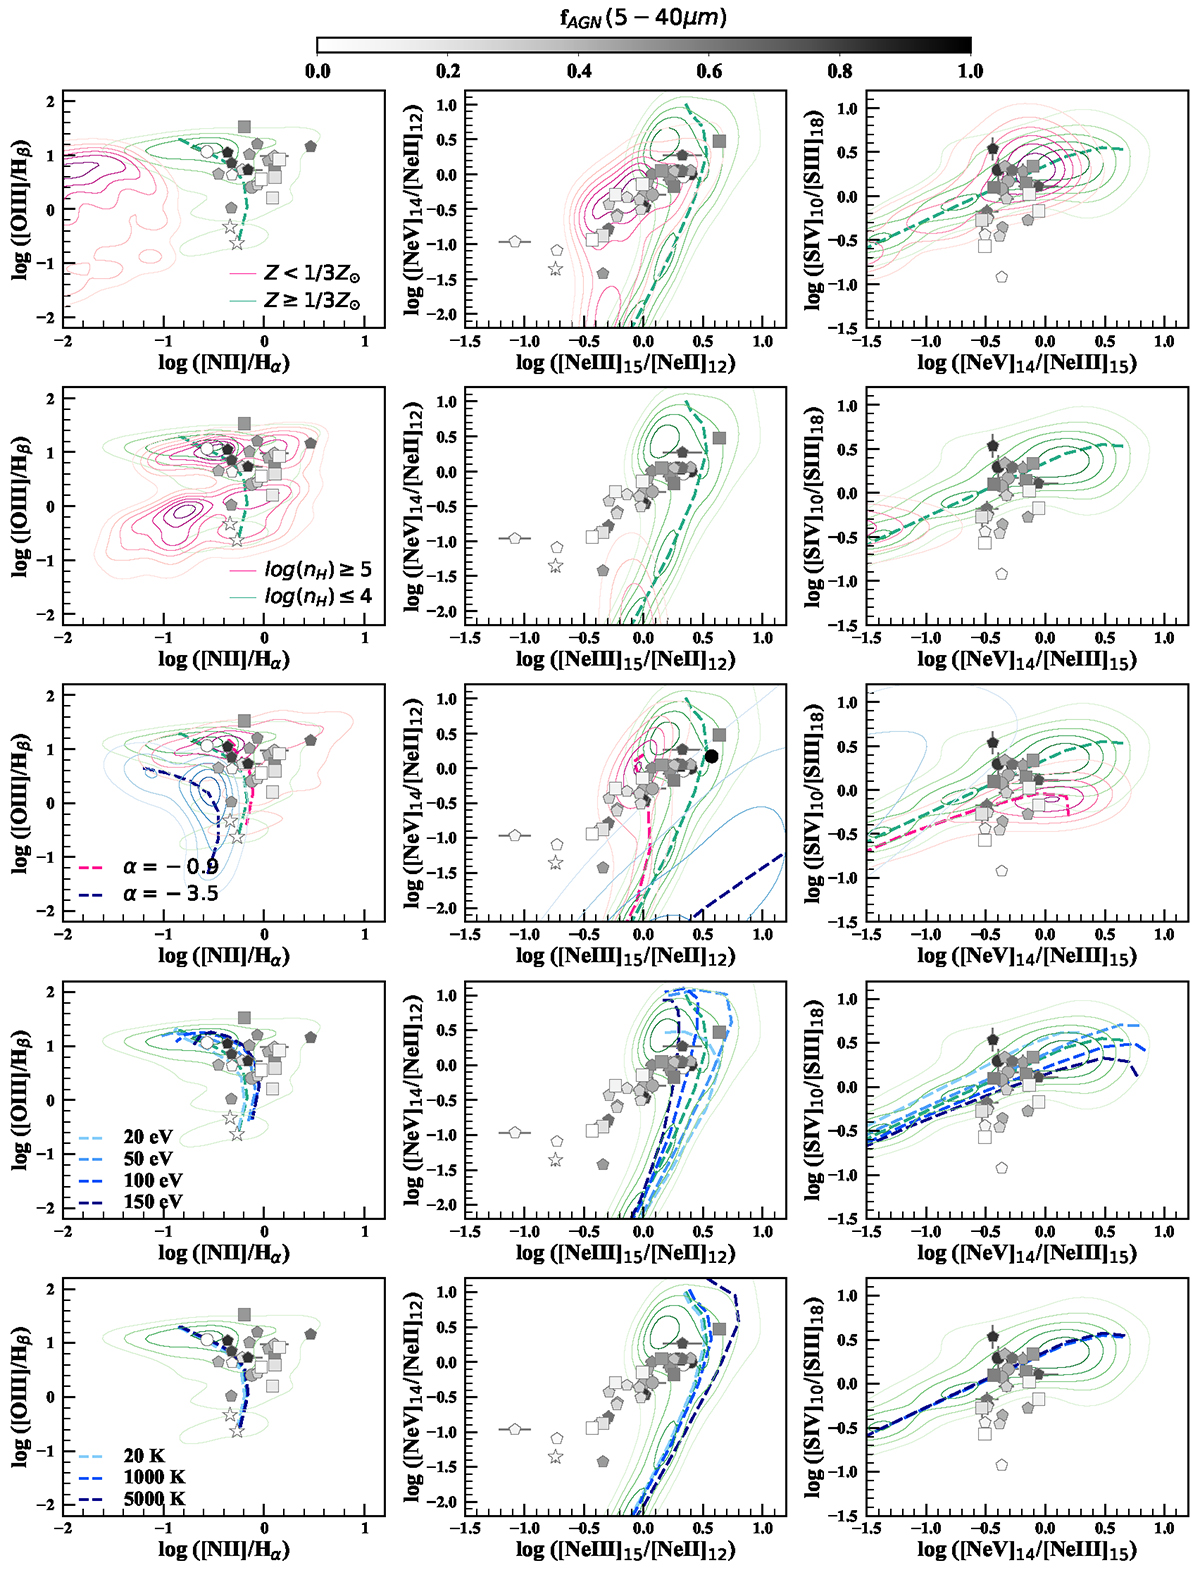
Download original image
Examples of one optical ([O III]/Hβ versus [N II]/Hα) and two mid-IR ([Ne V]/[Ne II] versus [Ne III]/[Ne II] and [S IV]/[S III] versus [Ne V]/[Ne III]) line ratio diagrams. Symbols and colors of the observations are the same as in Fig. 1. The dashed green lines and contours have the same meaning as in Fig. 5. Magenta contours in the first and second row of panels show AGN models with Z < 1/3 Z⊙ and nH ≥ 105 cm−3, respectively. Dashed blue and magenta curves and contours in the third row are models with α = −0.9 and α = −3.5 and with the other parameters the same as the green dashed curves and contours. The dashed blue shaded curves in the last two rows show AGN models with different energy peaks of the Big Blue Bump (second last row) and with the lower-limit temperature set to stop the calculations (last row), with values as labeled in the left panels.
Current usage metrics show cumulative count of Article Views (full-text article views including HTML views, PDF and ePub downloads, according to the available data) and Abstracts Views on Vision4Press platform.
Data correspond to usage on the plateform after 2015. The current usage metrics is available 48-96 hours after online publication and is updated daily on week days.
Initial download of the metrics may take a while.