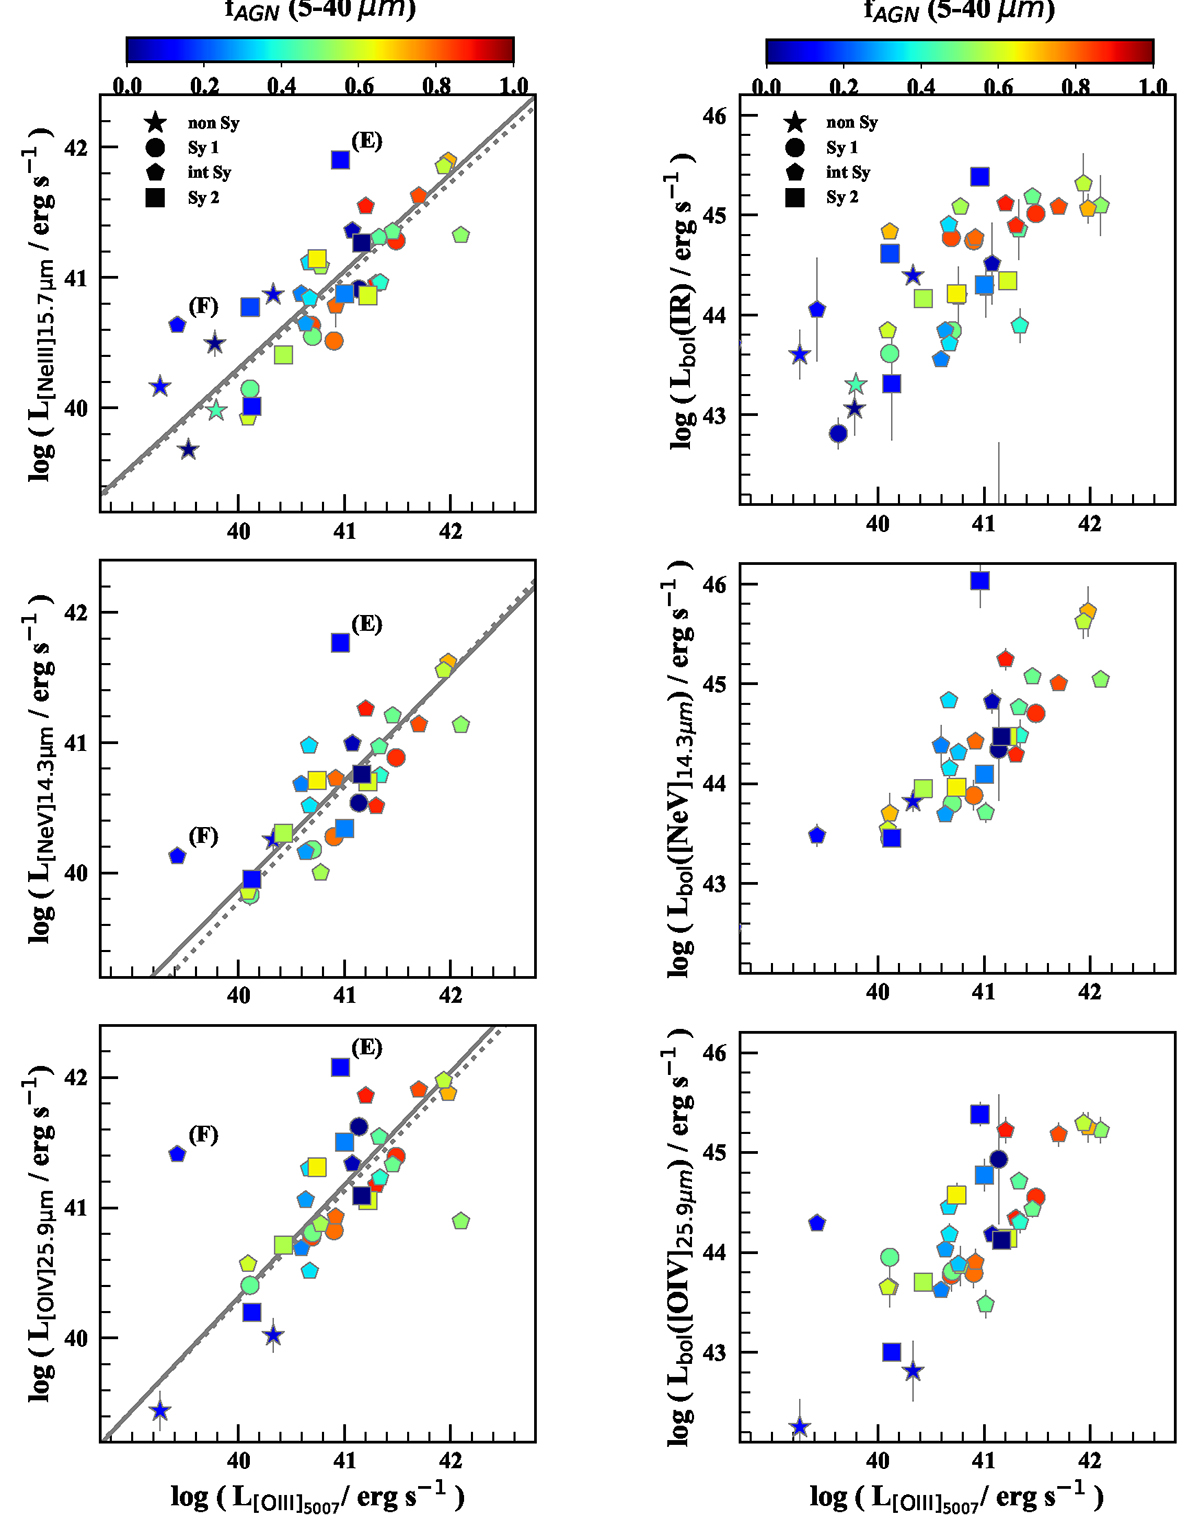
Fig. 4.
Download original image
[O III] luminosities measured in the SALT spectra, after dust attenuation correction and flux calibration, compared with luminosities of mid-IR lines ([Ne III], [Ne V], and [O IV], from top to bottom on the left) and with bolometric luminosities inferred in different ways (from SED fitting, [Ne V] lines, and [O IV] lines, from top to bottom on the right). Symbols and colors of the observations are the same as in Fig. 2. Solid lines show the relations in Eqs. (1)–(3), while dotted lines are those obtained considering the [O III] luminosities from Malkan et al. (2017).
Current usage metrics show cumulative count of Article Views (full-text article views including HTML views, PDF and ePub downloads, according to the available data) and Abstracts Views on Vision4Press platform.
Data correspond to usage on the plateform after 2015. The current usage metrics is available 48-96 hours after online publication and is updated daily on week days.
Initial download of the metrics may take a while.