Fig. 1.
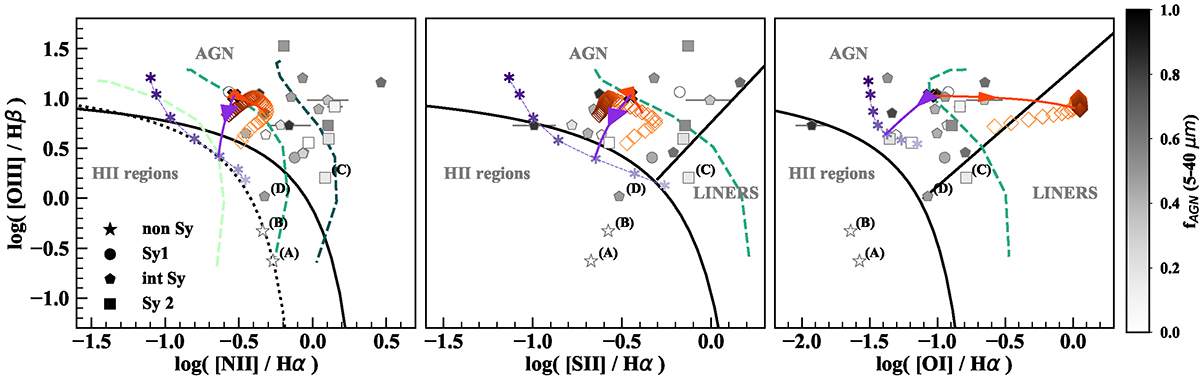
Download original image
Optical line ratio diagrams, [O III]/Hβ versus [N II]/Hα, [S II]/Hα, and [O I]/Hα (from left to right). Observations are color-coded with gray shades based on the AGN contribution to the mid-IR (5 − 40 μm), fAGN. Different symbols indicate the classification of the targets (as labeled in the legend). The solid black curves are the criteria for separating AGN from H II regions and LINERS proposed by Kewley et al. (2006). The dotted curve is the demarcation line between AGN and H II regions from Kauffmann et al. (2003). The dashed green curves indicate AGN models from F16 (Sect. 6.1) with Z = 0.017, nH = 103 cm−3, ξd = 0.3, α = −1.7, and the ionization parameter log(⟨U⟩) varying from −4.5 to −1.5 (from bottom to top). In the left panel, dashed lighter and darker green curves are for AGN models of Z = 0.008 and Z = 0.04. The arrows illustrate the effect of adding to an AGN model with Z = 0.017, log(⟨U⟩) = −2.5, nH = 103 cm−3, ξd = 0.3, and α = −1.7 (black cross) a 0% to 90% fractional contribution from star formation (violet) and shocks (orange) to the total Hβ line emission. The asterisks (empty diamonds) indicate predictions of AGN+SF (AGN+shocks) models with 90% contribution to the total Hβ line from the star formation (shocks). The ionization parameter of the stellar models increases from log(⟨U⋆⟩) = −3.0 (from the lighter to the darkest violet shade). The shock velocity increases from 200 to 1000 km s−1 (from the lighter to the darkest orange shade).
Current usage metrics show cumulative count of Article Views (full-text article views including HTML views, PDF and ePub downloads, according to the available data) and Abstracts Views on Vision4Press platform.
Data correspond to usage on the plateform after 2015. The current usage metrics is available 48-96 hours after online publication and is updated daily on week days.
Initial download of the metrics may take a while.