Open Access
Fig. 9
Download original image
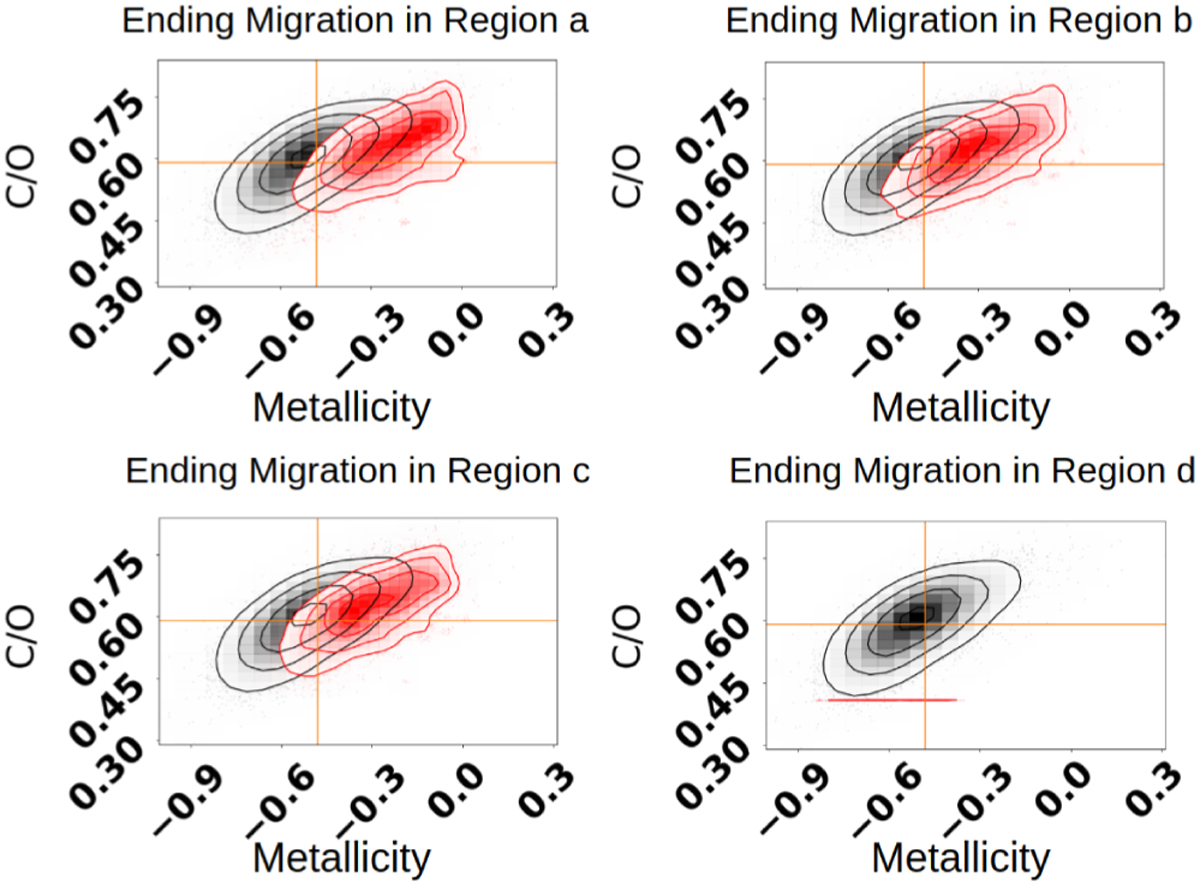
Comparison of the observed C/O ratio and [(C+O)/H] distribution (black) to that of the planets that end their Type II migration (red). Each panel shows this distribution for planets that end their Type II migration in the indicated region on top of the panel. The assumptions are the same as in Fig. 6 but for Scenario 2.
Current usage metrics show cumulative count of Article Views (full-text article views including HTML views, PDF and ePub downloads, according to the available data) and Abstracts Views on Vision4Press platform.
Data correspond to usage on the plateform after 2015. The current usage metrics is available 48-96 hours after online publication and is updated daily on week days.
Initial download of the metrics may take a while.