Fig. 8.
Download original image
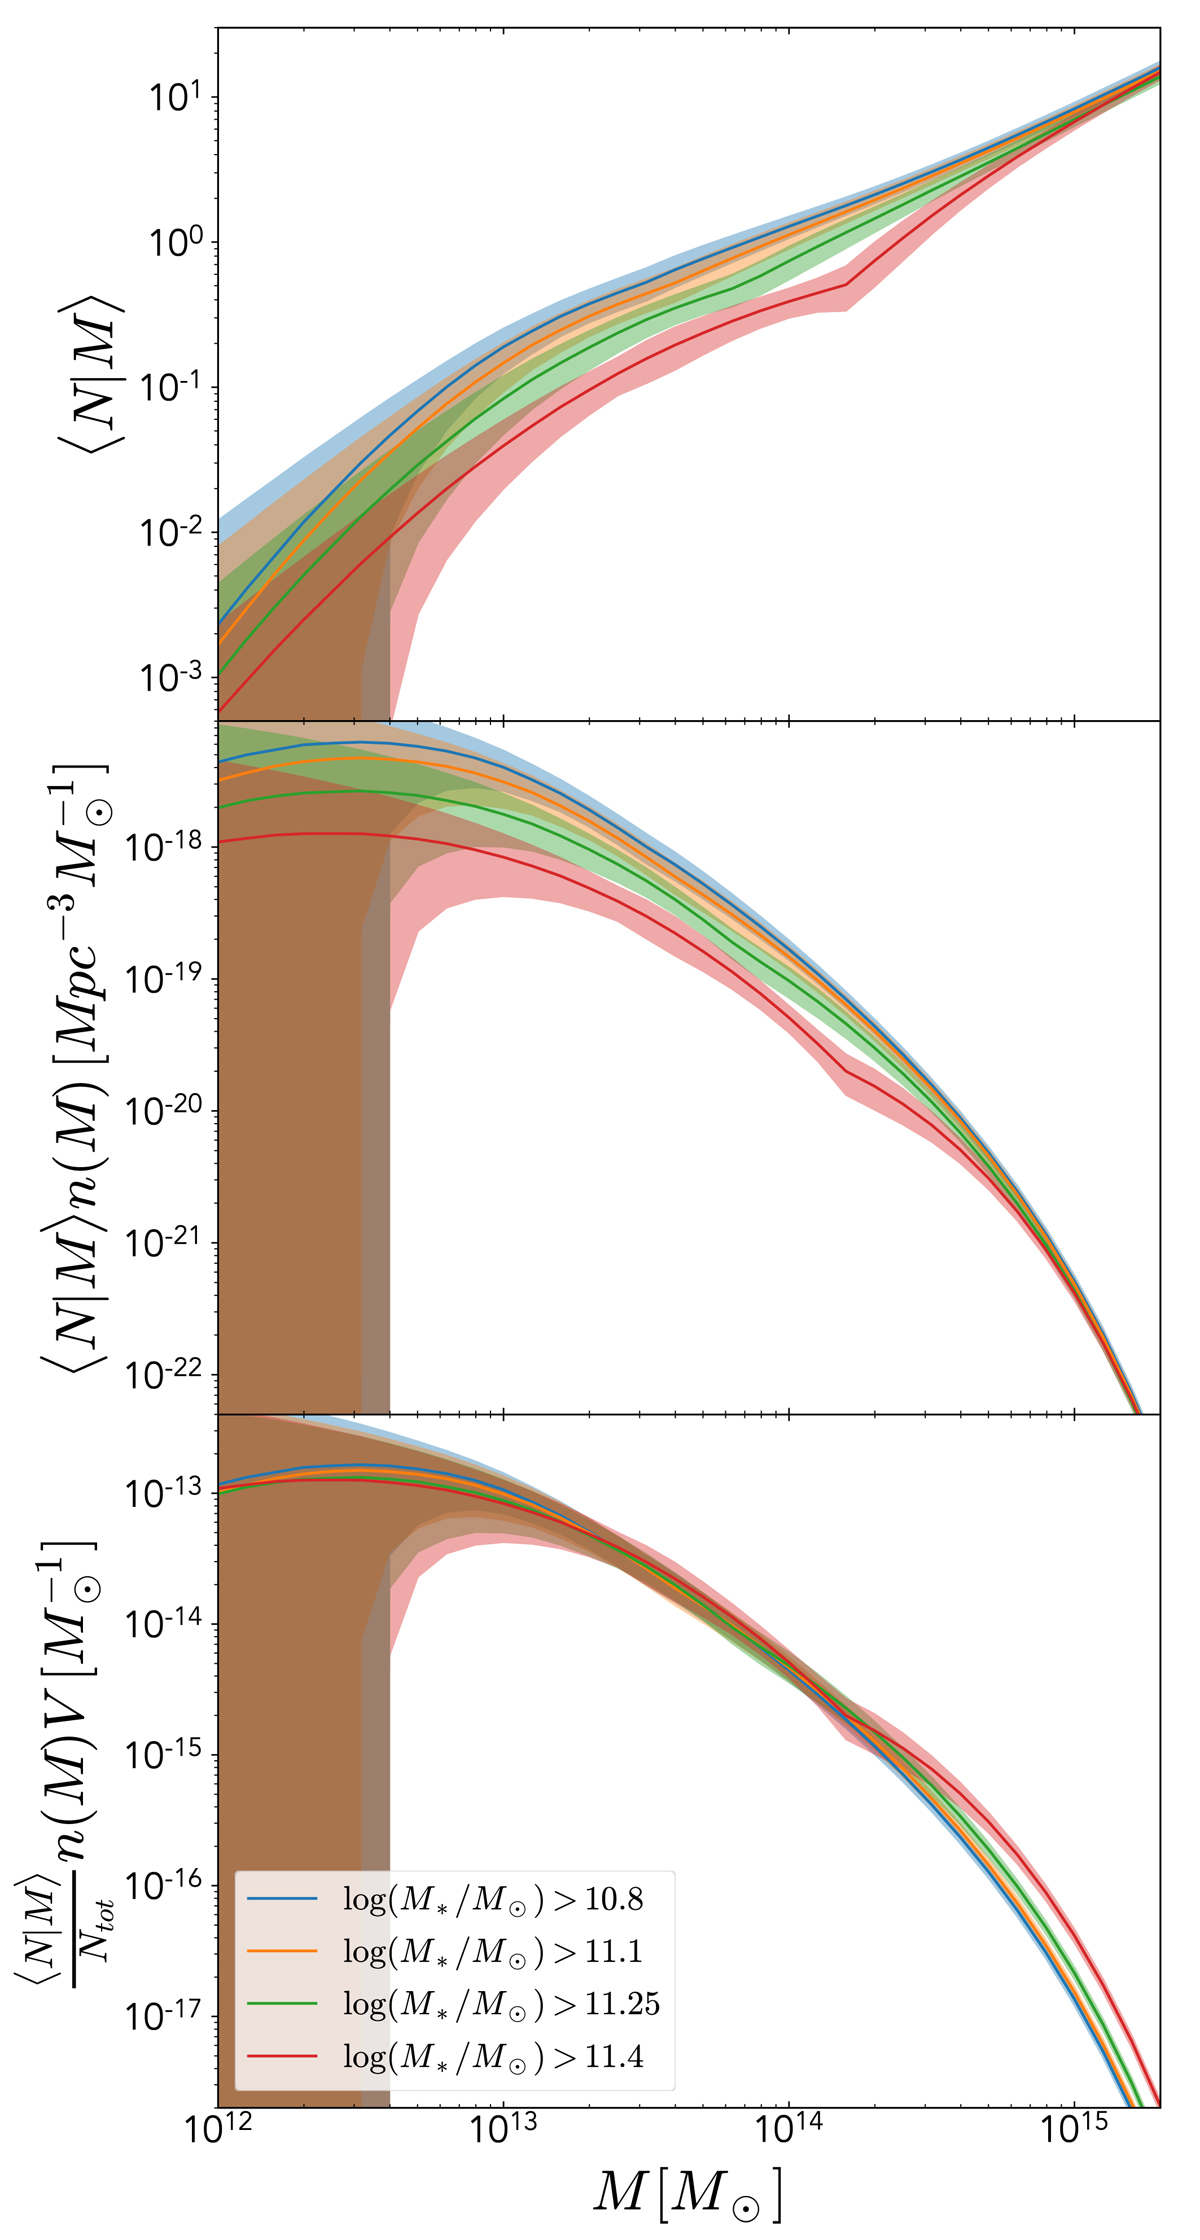
Galaxy distribution as a function of the host halo mass. Top: Total (central + satellite) number of galaxies contained in halos as a function of halo mass, M, evaluated at the sample median redshift. The four curves correspond to the different stellar mass threshold bins. The shaded bands represent the 1σ uncertainty. Middle: Total number of galaxies per comoving volume and halo mass range (in units of Mpc−3 ![]() ) as a function of halo mass. Bottom: Total number of galaxies per halo mass range normalized by the number of galaxies in each stellar mass bin. This fraction of galaxies lies in a halo of mass M. The quantity V appearing in the label stands for the comoving volume.
) as a function of halo mass. Bottom: Total number of galaxies per halo mass range normalized by the number of galaxies in each stellar mass bin. This fraction of galaxies lies in a halo of mass M. The quantity V appearing in the label stands for the comoving volume.
Current usage metrics show cumulative count of Article Views (full-text article views including HTML views, PDF and ePub downloads, according to the available data) and Abstracts Views on Vision4Press platform.
Data correspond to usage on the plateform after 2015. The current usage metrics is available 48-96 hours after online publication and is updated daily on week days.
Initial download of the metrics may take a while.