Open Access
Fig. 4.
Download original image
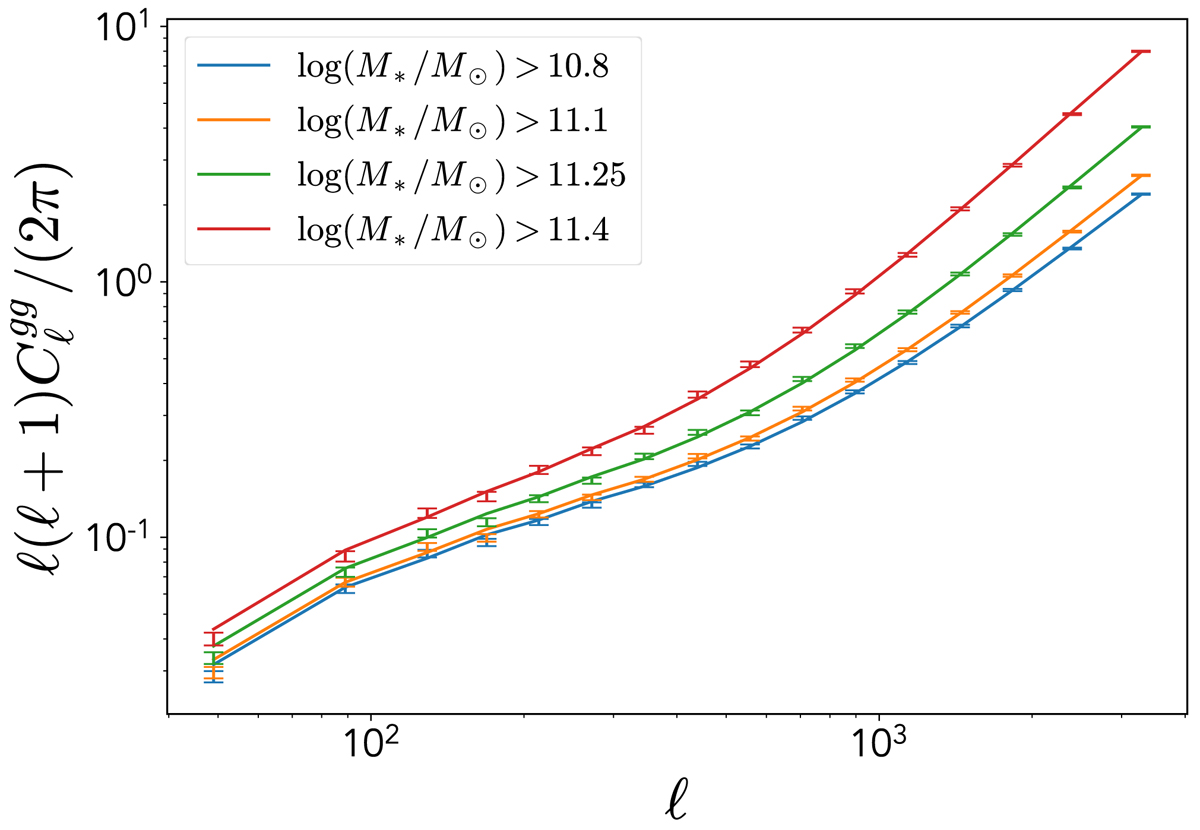
Observed and best-fit galaxy angular auto-power spectra, ![]() , for the four different stellar mass threshold bins. The same colors are used for the observed error bars and the corresponding theoretical best fit in each stellar mass bin.
, for the four different stellar mass threshold bins. The same colors are used for the observed error bars and the corresponding theoretical best fit in each stellar mass bin.
Current usage metrics show cumulative count of Article Views (full-text article views including HTML views, PDF and ePub downloads, according to the available data) and Abstracts Views on Vision4Press platform.
Data correspond to usage on the plateform after 2015. The current usage metrics is available 48-96 hours after online publication and is updated daily on week days.
Initial download of the metrics may take a while.