Fig. 3.
Download original image
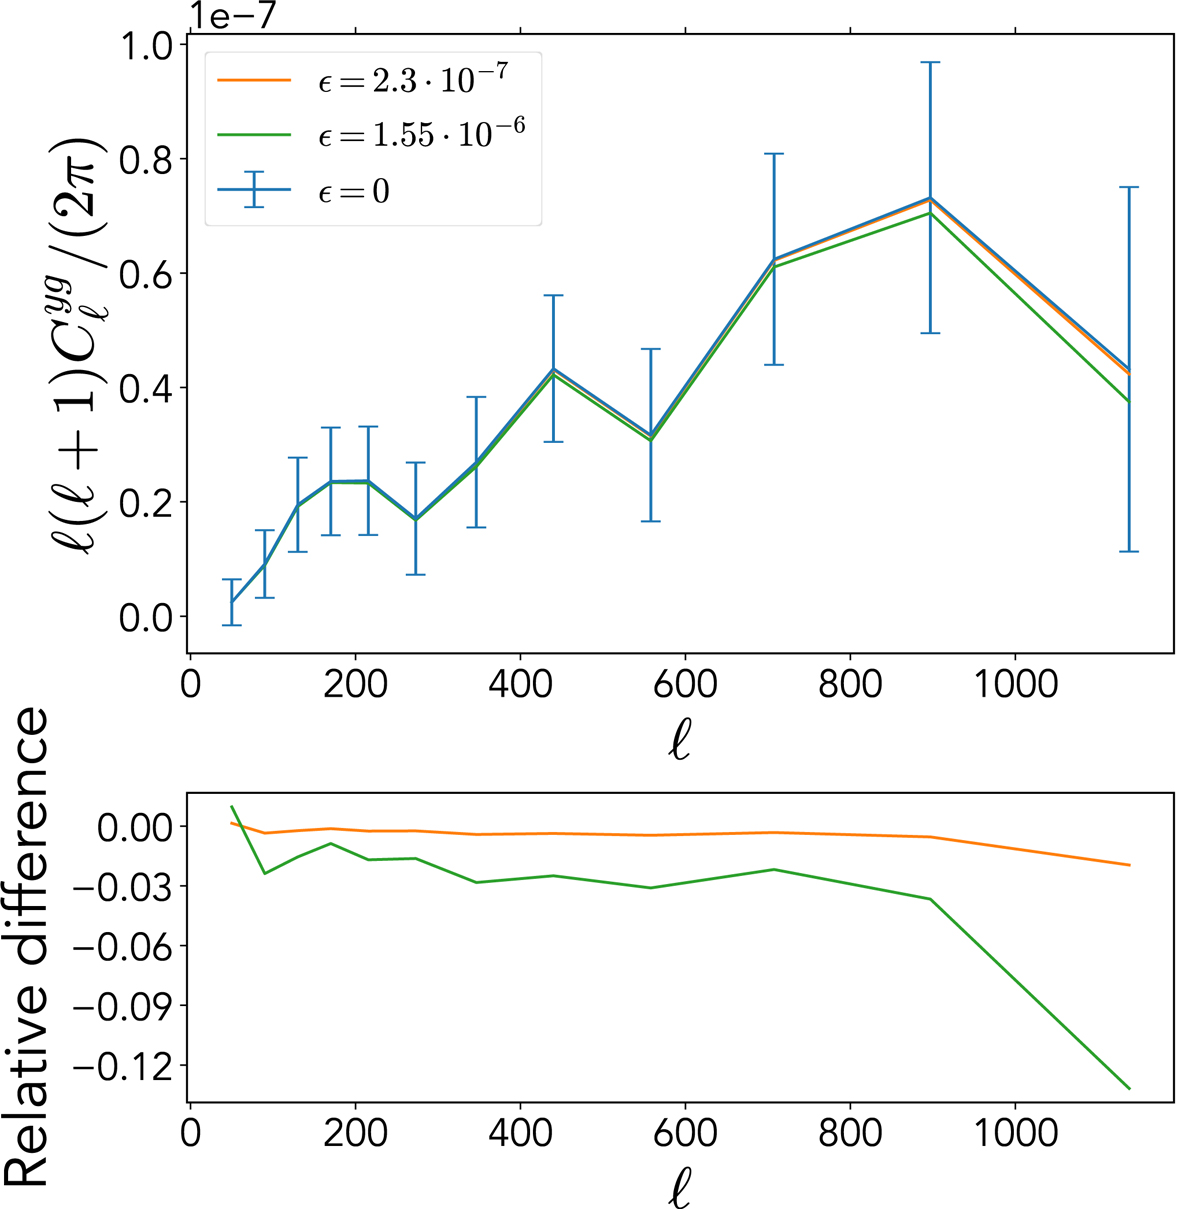
Impact of CIB decontamination on yg cross-power spectrum. Top: Measured yg cross-power spectrum (in blue) along with the associated uncertainties. The orange (green) curve is the CIB-decontaminated curve using the best-fit (the 2σ upper) value for ϵCIB. Bottom: Relative difference between the CIB-decontaminated curves and our raw measured yg cross-power spectrum. On the scales we considered, the effect of the CIB decontamination is 2.0% at most with the best-fit value of ϵCIB, and 13.2% at most with the 2σ upper value.
Current usage metrics show cumulative count of Article Views (full-text article views including HTML views, PDF and ePub downloads, according to the available data) and Abstracts Views on Vision4Press platform.
Data correspond to usage on the plateform after 2015. The current usage metrics is available 48-96 hours after online publication and is updated daily on week days.
Initial download of the metrics may take a while.