Open Access
Fig. 6.
Download original image
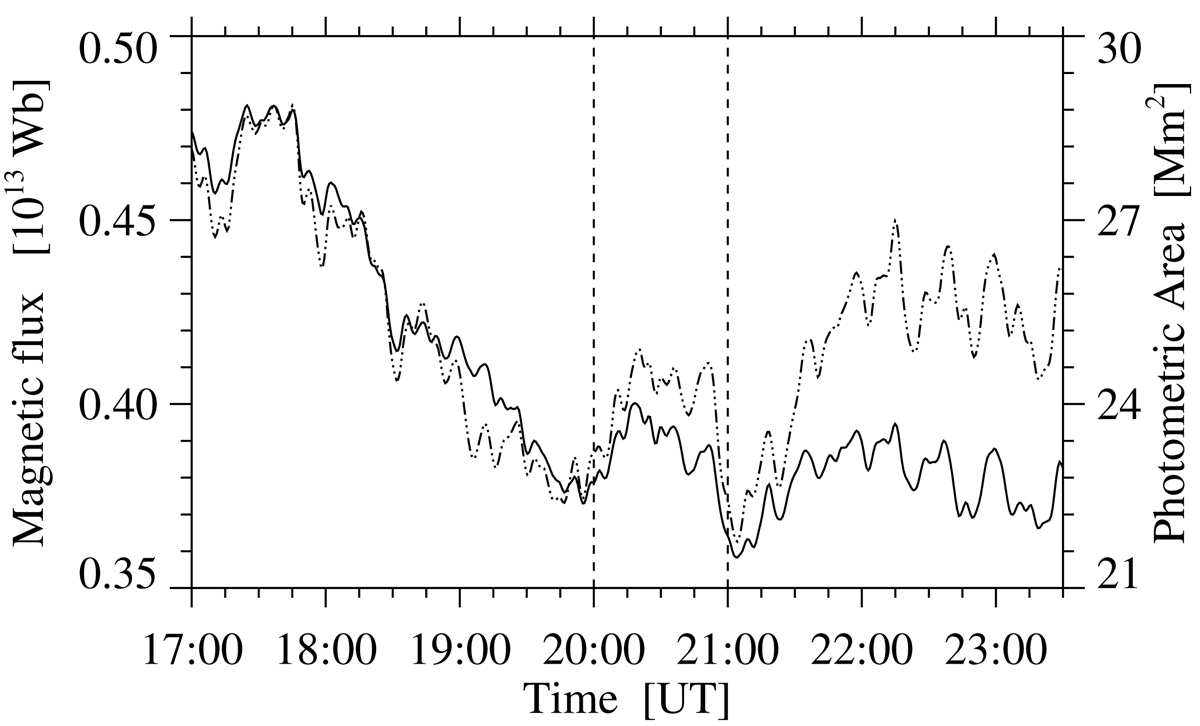
Evolution of the magnetic flux (solid) and photometric area (dashed) on 2015 April 1 for a FOV of 95″ × 95″ covering positive-polarity pores in active region NOAA 12317. The two dashed vertical lines demarcate the two time periods 17:00–20:00 UT and 21:00–23:30 UT used for further analysis.
Current usage metrics show cumulative count of Article Views (full-text article views including HTML views, PDF and ePub downloads, according to the available data) and Abstracts Views on Vision4Press platform.
Data correspond to usage on the plateform after 2015. The current usage metrics is available 48-96 hours after online publication and is updated daily on week days.
Initial download of the metrics may take a while.