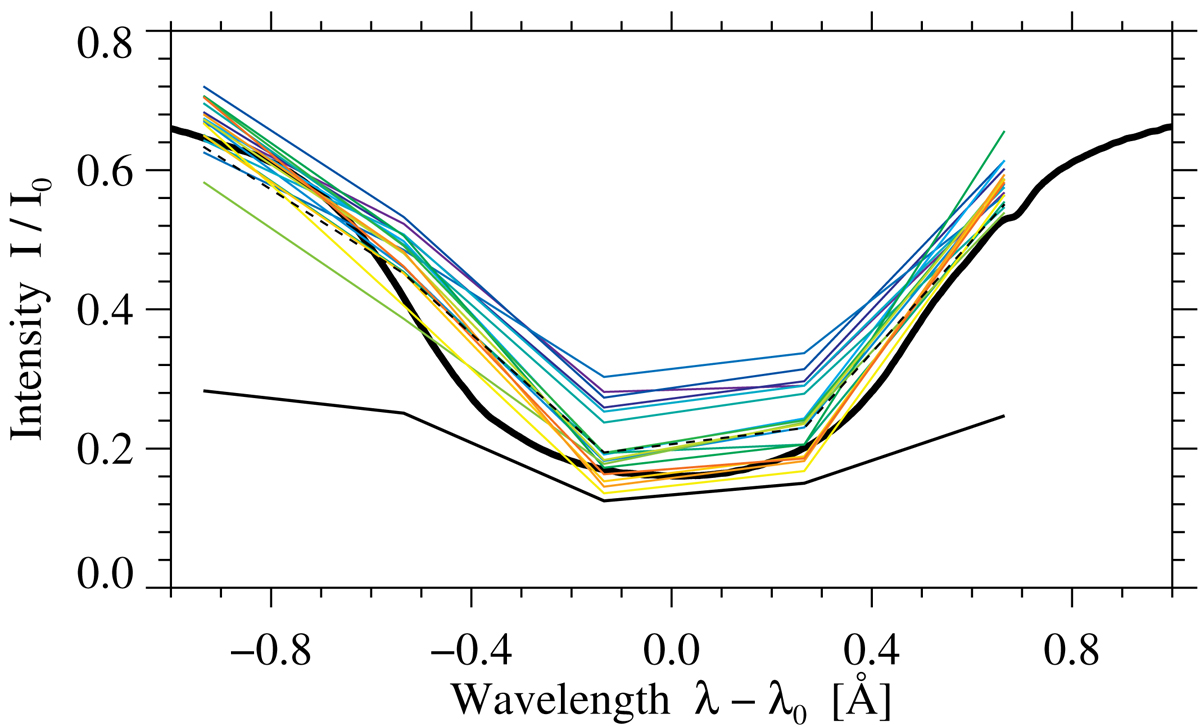
Fig. 5.
Download original image
Color-coded Hα line profiles, which are marked by matching crosses in Fig. 4. The dashed black line represents the average of the color-coded line profiles. The thin, solid black line refers to an Hα profile of a pore, as indicated by the white asterisk in Fig. 4 inside pore P2. The thick, solid black line denotes the Kitt Peak FTS disk-center spectral atlas, which served as a reference in the wavelength calibration.
Current usage metrics show cumulative count of Article Views (full-text article views including HTML views, PDF and ePub downloads, according to the available data) and Abstracts Views on Vision4Press platform.
Data correspond to usage on the plateform after 2015. The current usage metrics is available 48-96 hours after online publication and is updated daily on week days.
Initial download of the metrics may take a while.